Note
Click here to download the full example code
Composing Custom Legends
Composing custom legends piece-by-piece.
Note
For more information on creating and customizing legends, see the following pages:
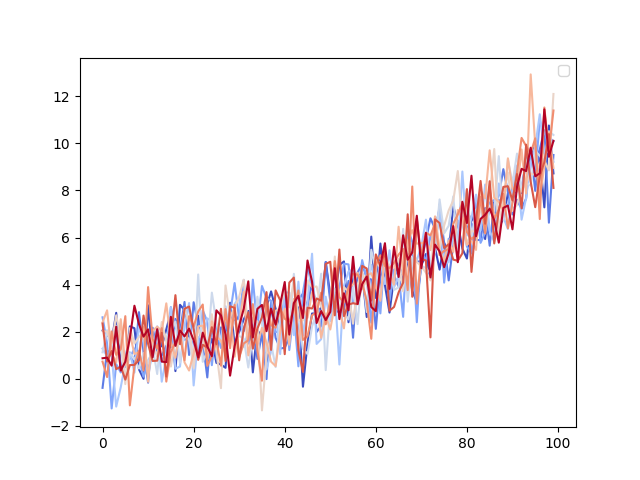
Sometimes you don't want a legend that is explicitly tied to data that
you have plotted. For example, say you have plotted 10 lines, but don't
want a legend item to show up for each one. If you simply plot the lines
and call ax.legend(), you will get the following:
from matplotlib import rcParams, cycler
import matplotlib.pyplot as plt
import numpy as np

# Fixing random state for reproducibility
np.random.seed(19680801)

N = 10
data = (np.geomspace(1, 10, 100) + np.random.randn(N, 100)).T
cmap = plt.cm.coolwarm
rcParams['axes.prop_cycle'] = cycler(color=cmap(np.linspace(0, 1, N)))

fig, ax = plt.subplots()
lines = ax.plot(data)
ax.legend()
Out:
No artists with labels found to put in legend.  Note that artists whose label start with an underscore are ignored when legend() is called with no argument.

<matplotlib.legend.Legend object at 0x7fd2007f5460>
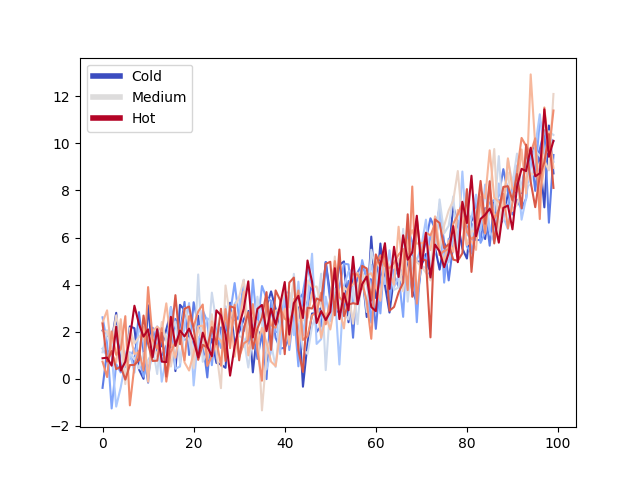
Note that no legend entries were created. In this case, we can compose a legend using Matplotlib objects that aren't explicitly tied to the data that was plotted. For example:
from matplotlib.lines import Line2D
custom_lines = [Line2D([0], [0], color=cmap(0.), lw=4),
                Line2D([0], [0], color=cmap(.5), lw=4),
                Line2D([0], [0], color=cmap(1.), lw=4)]

fig, ax = plt.subplots()
lines = ax.plot(data)
ax.legend(custom_lines, ['Cold', 'Medium', 'Hot'])
Out:
<matplotlib.legend.Legend object at 0x7fd2002556a0>
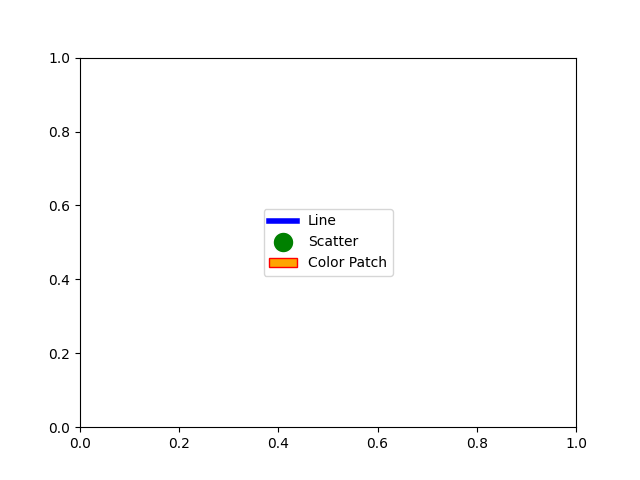
There are many other Matplotlib objects that can be used in this way. In the code below we've listed a few common ones.
from matplotlib.patches import Patch
from matplotlib.lines import Line2D

legend_elements = [Line2D([0], [0], color='b', lw=4, label='Line'),
                   Line2D([0], [0], marker='o', color='w', label='Scatter',
                          markerfacecolor='g', markersize=15),
                   Patch(facecolor='orange', edgecolor='r',
                         label='Color Patch')]

# Create the figure
fig, ax = plt.subplots()
ax.legend(handles=legend_elements, loc='center')

plt.show()
Total running time of the script: ( 0 minutes 1.959 seconds)
Keywords: matplotlib code example, codex, python plot, pyplot Gallery generated by Sphinx-Gallery