Note
Click here to download the full example code
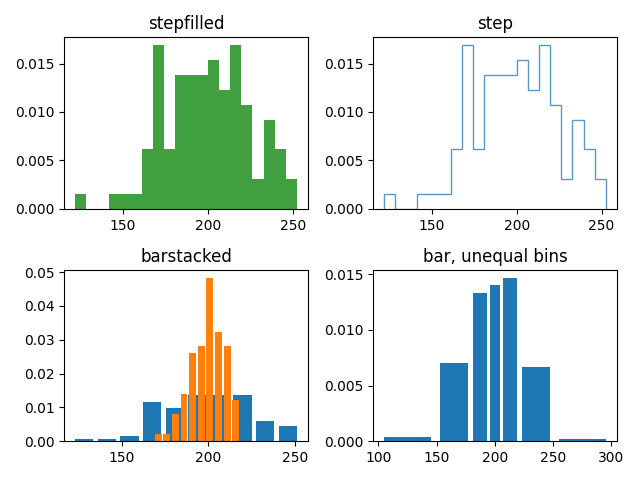
Demo of the histogram function's different histtype settings
Histogram with step curve that has a color fill.
Histogram with step curve with no fill.
Histogram with custom and unequal bin widths.
Two histograms with stacked bars.
Selecting different bin counts and sizes can significantly affect the shape of a histogram. The Astropy docs have a great section on how to select these parameters: http://docs.astropy.org/en/stable/visualization/histogram.html
import numpy as np
import matplotlib.pyplot as plt

np.random.seed(19680801)

mu_x = 200
sigma_x = 25
x = np.random.normal(mu_x, sigma_x, size=100)

mu_w = 200
sigma_w = 10
w = np.random.normal(mu_w, sigma_w, size=100)

fig, axs = plt.subplots(nrows=2, ncols=2)

axs[0, 0].hist(x, 20, density=True, histtype='stepfilled', facecolor='g',
               alpha=0.75)
axs[0, 0].set_title('stepfilled')

axs[0, 1].hist(x, 20, density=True, histtype='step', facecolor='g',
               alpha=0.75)
axs[0, 1].set_title('step')

axs[1, 0].hist(x, density=True, histtype='barstacked', rwidth=0.8)
axs[1, 0].hist(w, density=True, histtype='barstacked', rwidth=0.8)
axs[1, 0].set_title('barstacked')

# Create a histogram by providing the bin edges (unequally spaced).
bins = [100, 150, 180, 195, 205, 220, 250, 300]
axs[1, 1].hist(x, bins, density=True, histtype='bar', rwidth=0.8)
axs[1, 1].set_title('bar, unequal bins')

fig.tight_layout()
plt.show()
References
The use of the following functions, methods, classes and modules is shown in this example:
Keywords: matplotlib code example, codex, python plot, pyplot Gallery generated by Sphinx-Gallery