Note
Click here to download the full example code
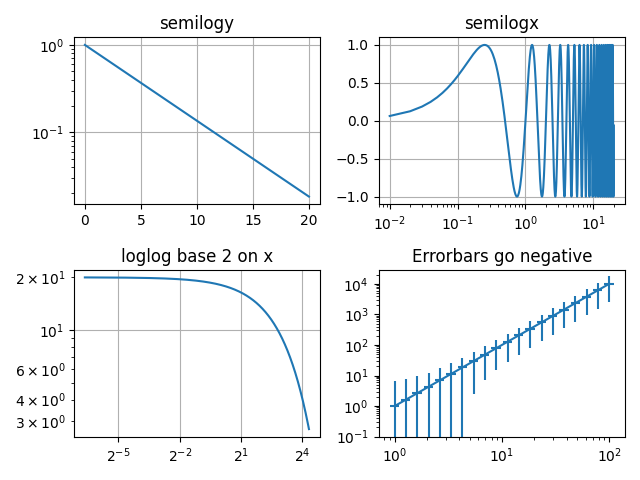
Log Demo
Examples of plots with logarithmic axes.
import numpy as np
import matplotlib.pyplot as plt

# Data for plotting
t = np.arange(0.01, 20.0, 0.01)

# Create figure
fig, ((ax1, ax2), (ax3, ax4)) = plt.subplots(2, 2)

# log y axis
ax1.semilogy(t, np.exp(-t / 5.0))
ax1.set(title='semilogy')
ax1.grid()

# log x axis
ax2.semilogx(t, np.sin(2 * np.pi * t))
ax2.set(title='semilogx')
ax2.grid()

# log x and y axis
ax3.loglog(t, 20 * np.exp(-t / 10.0))
ax3.set_xscale('log', base=2)
ax3.set(title='loglog base 2 on x')
ax3.grid()

# With errorbars: clip non-positive values
# Use new data for plotting
x = 10.0**np.linspace(0.0, 2.0, 20)
y = x**2.0

ax4.set_xscale("log", nonpositive='clip')
ax4.set_yscale("log", nonpositive='clip')
ax4.set(title='Errorbars go negative')
ax4.errorbar(x, y, xerr=0.1 * x, yerr=5.0 + 0.75 * y)
# ylim must be set after errorbar to allow errorbar to autoscale limits
ax4.set_ylim(bottom=0.1)

fig.tight_layout()
plt.show()
Total running time of the script: ( 0 minutes 1.240 seconds)
Keywords: matplotlib code example, codex, python plot, pyplot Gallery generated by Sphinx-Gallery