Examples
This page contains example plots. Click on any image to see the full image and source code.
For longer tutorials, see our tutorials page. You can also find external resources and a FAQ in our user guide.
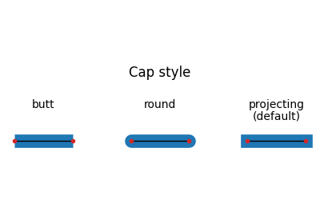
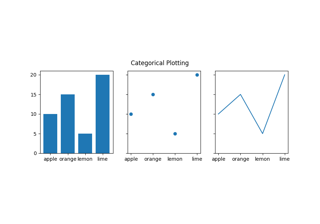
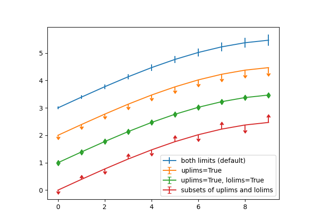
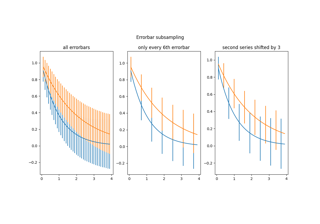
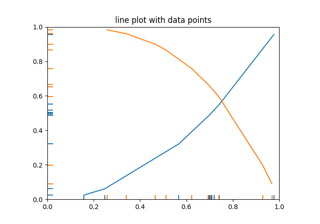
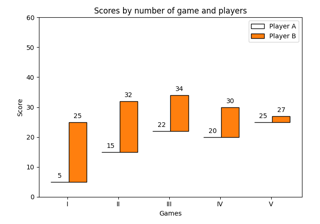
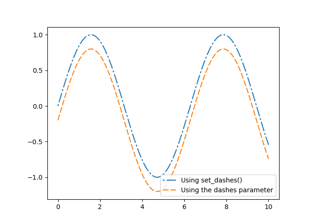
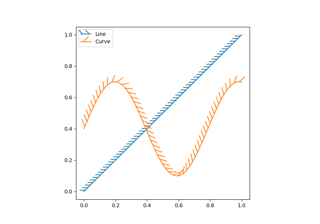
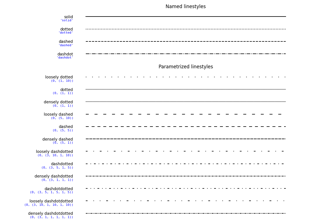
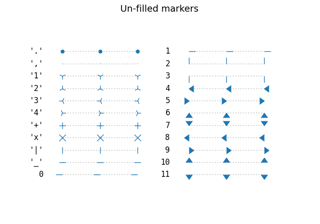
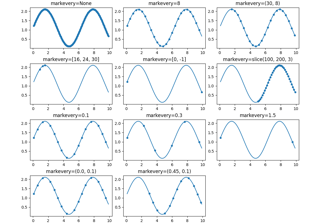
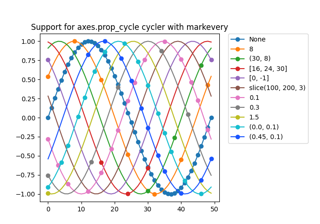
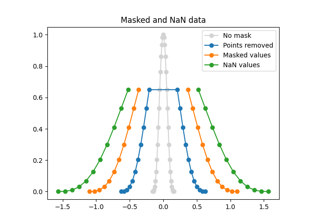
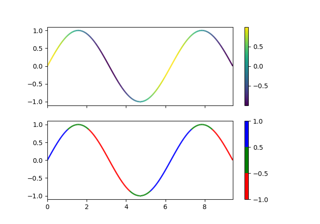
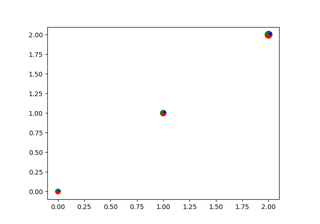
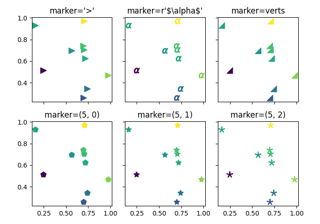
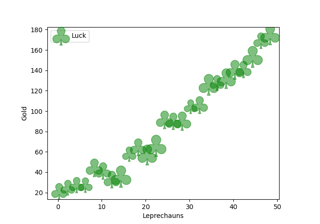
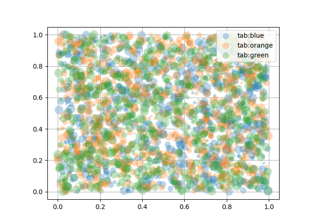
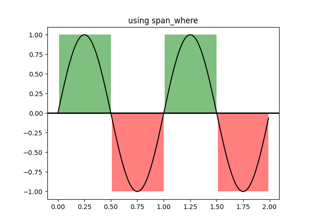
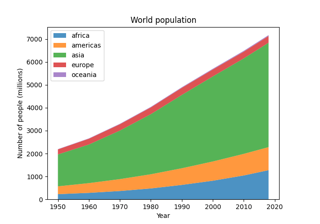
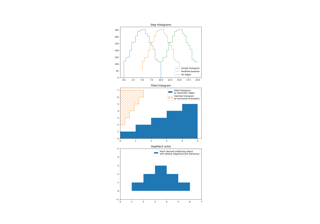
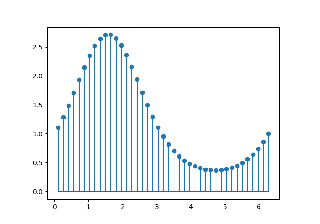
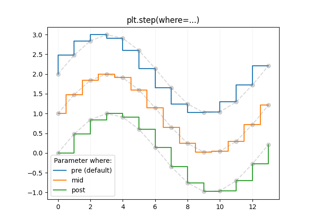
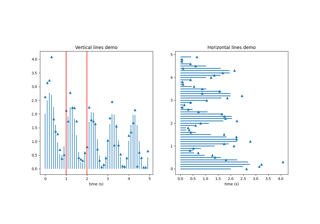
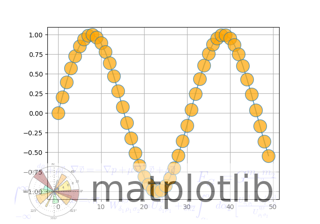
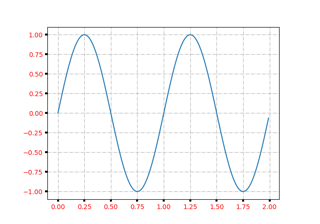
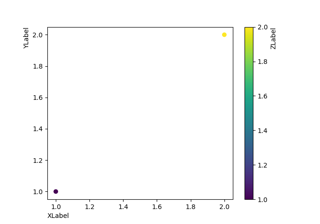
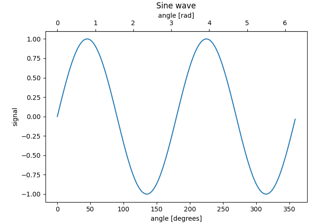
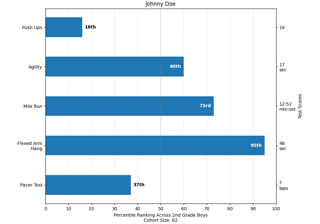
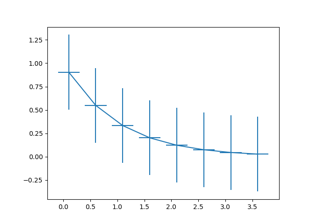
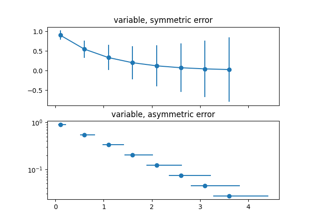
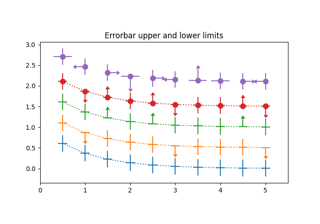
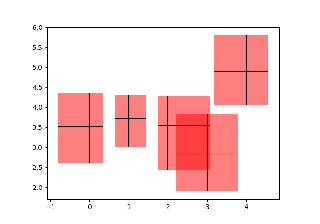
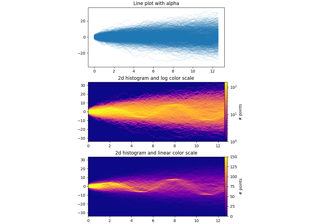
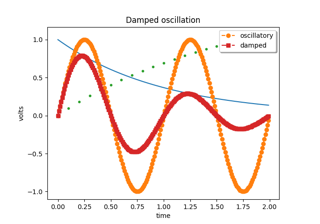
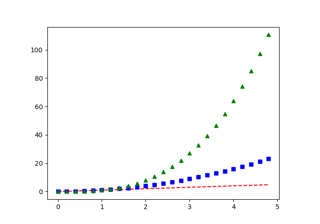
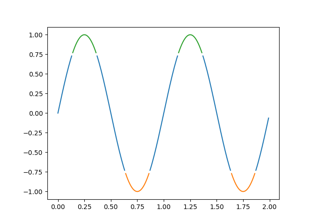
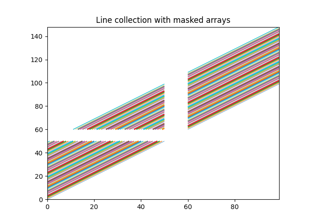
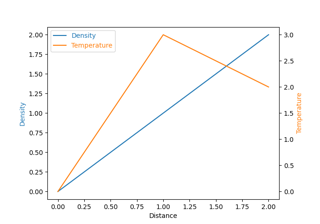
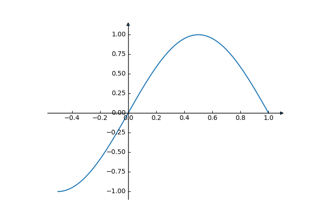
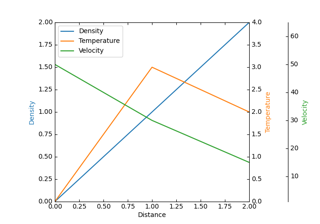
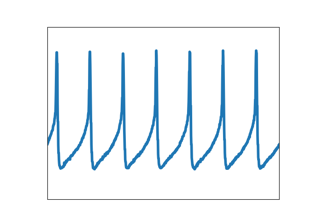
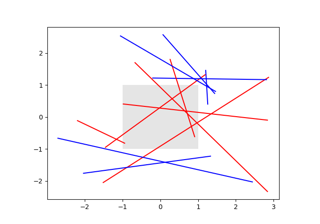
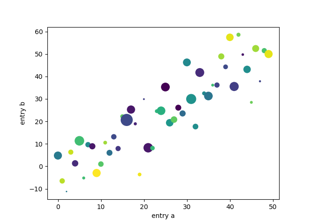
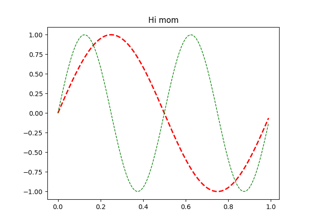
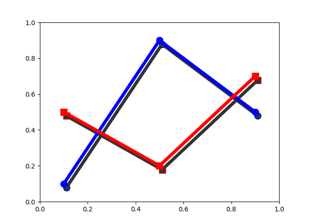
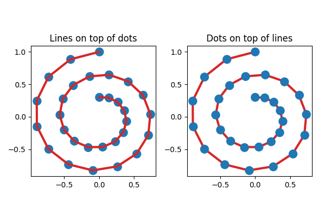
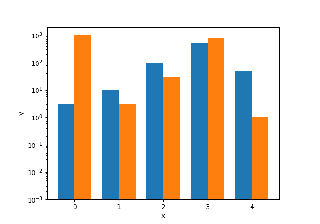
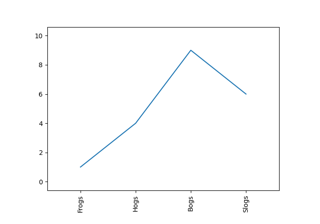
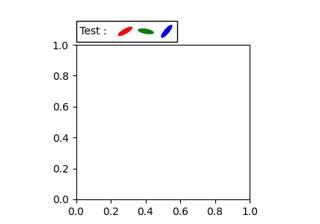
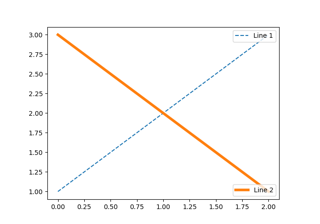
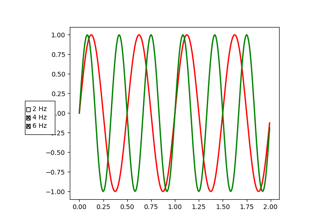
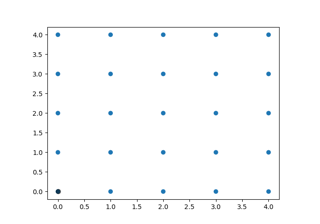
Lines, bars and markers
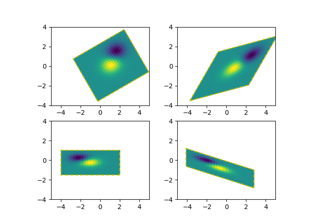
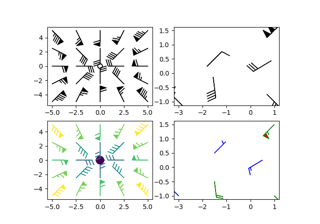
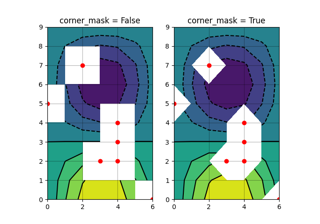
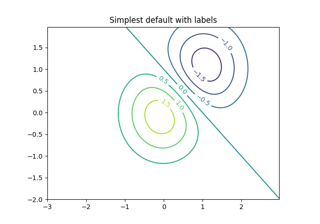
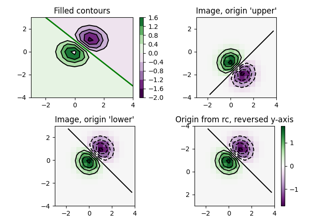
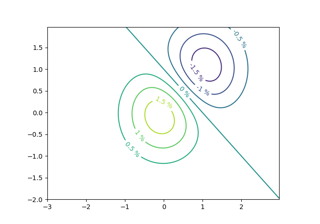
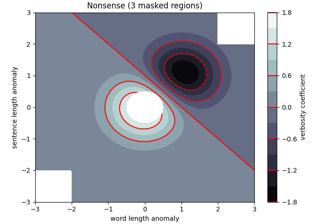
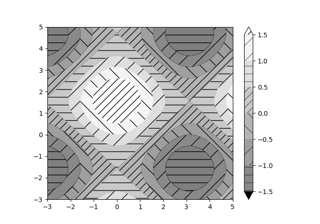
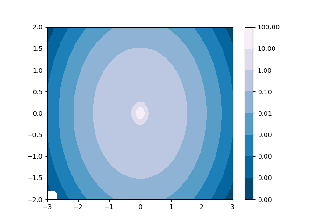
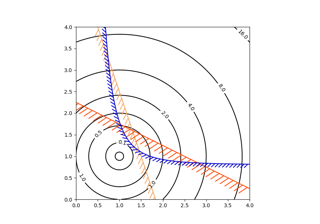
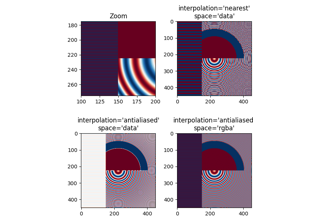
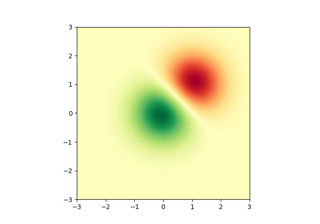
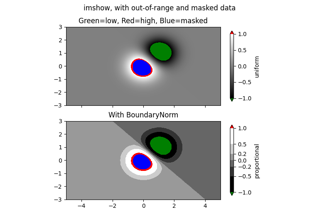
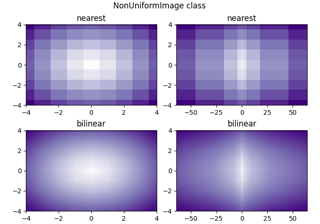
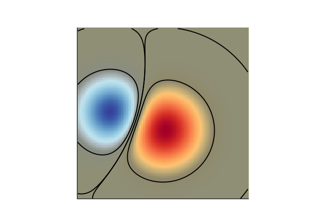
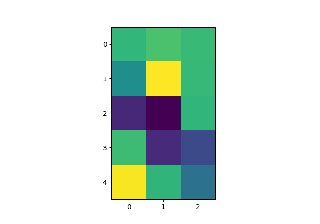
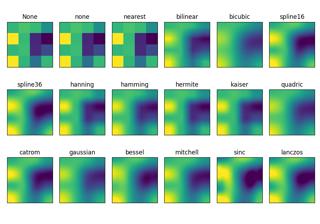
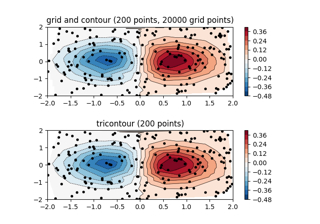
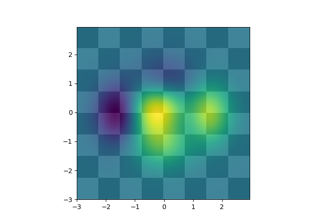
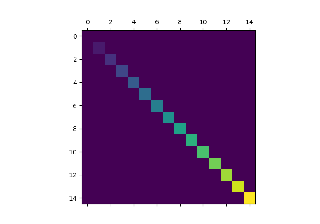
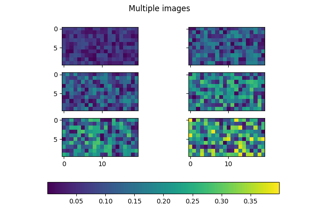
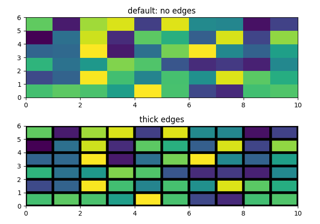
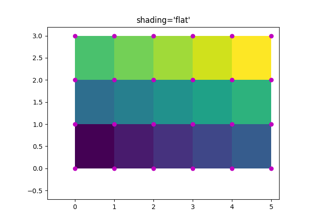
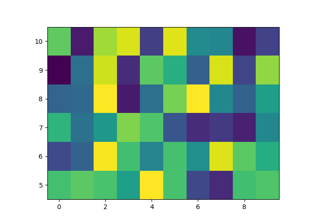
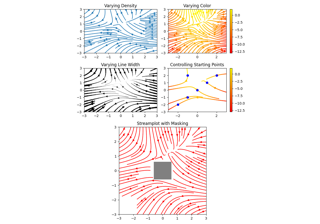
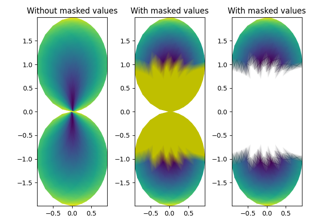
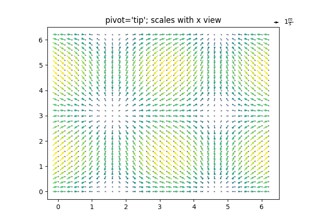
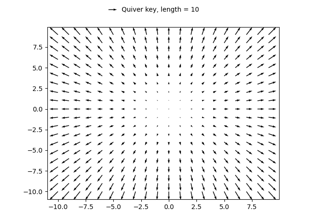
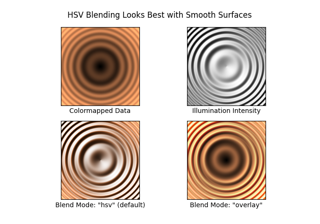
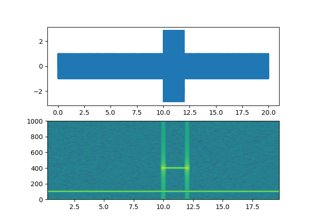
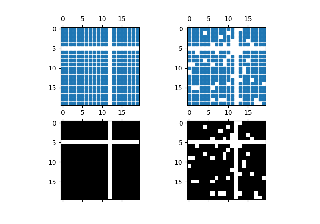
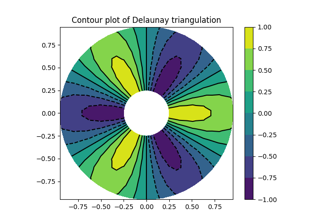
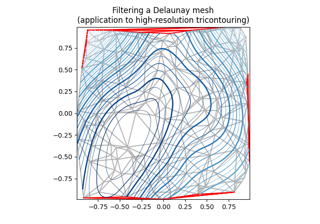
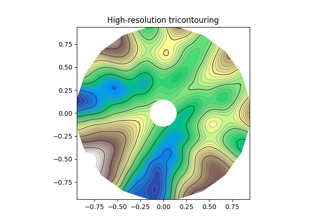
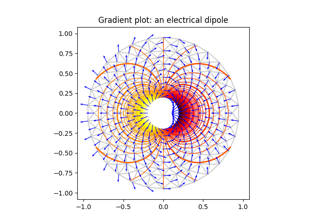
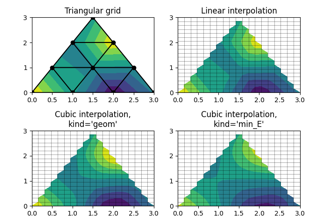
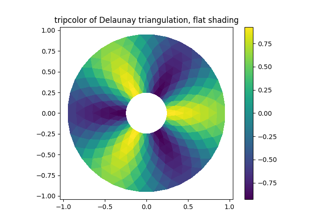
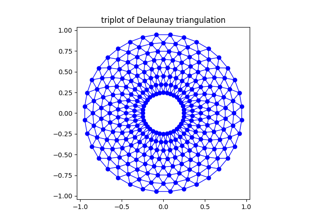
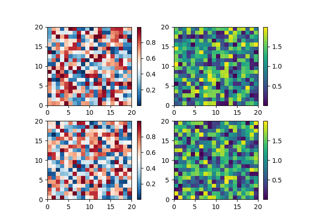
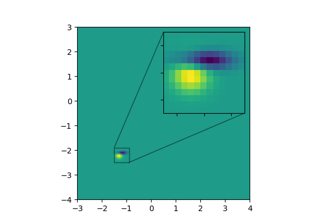
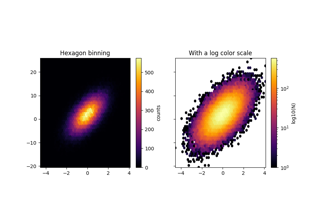
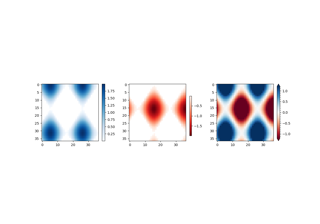
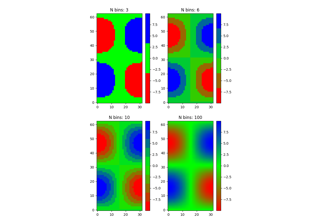
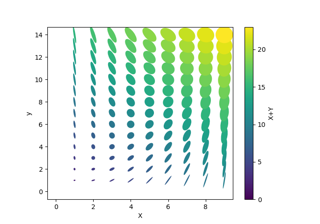
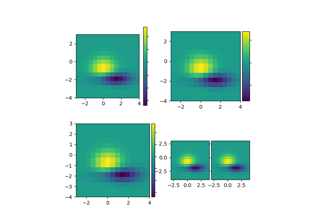
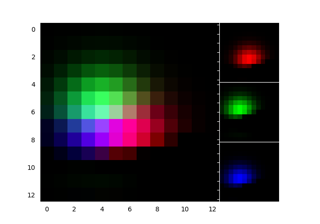
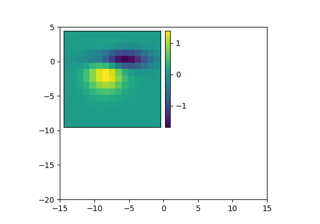
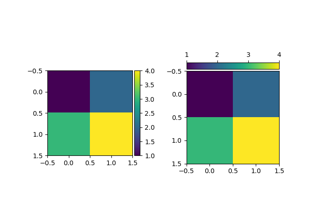
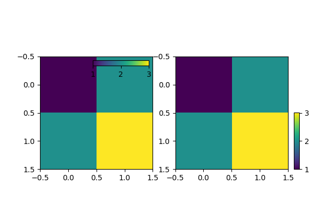
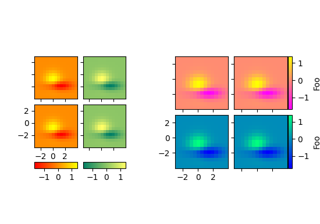
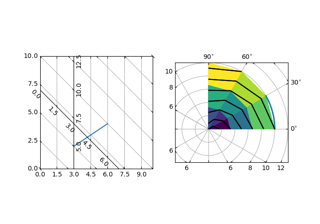
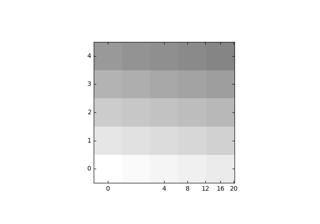
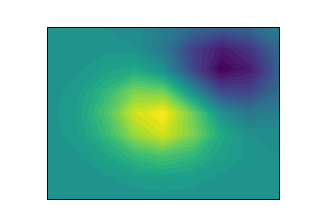
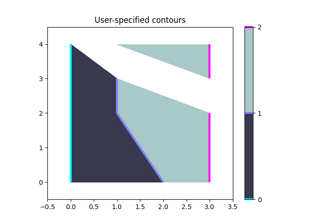
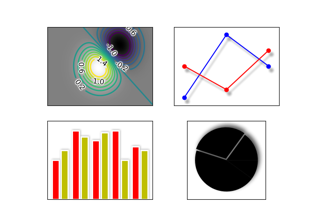
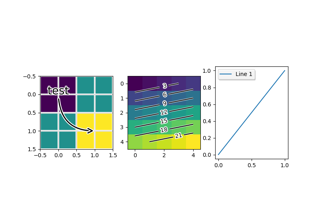
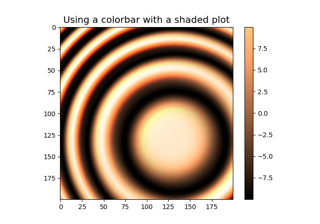
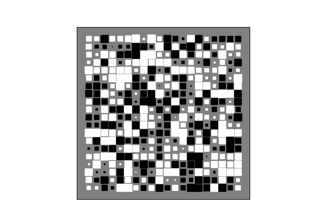
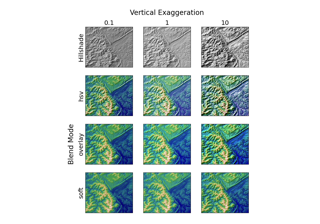
Images, contours and fields


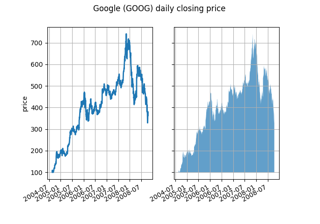
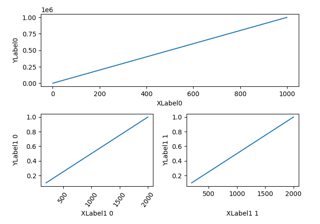
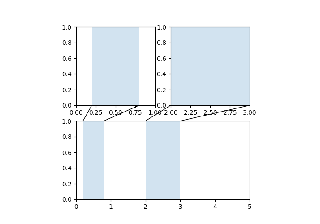
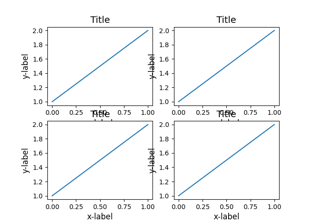
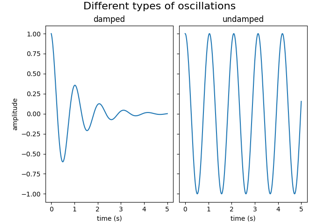
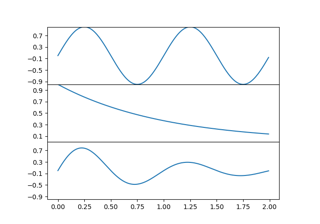
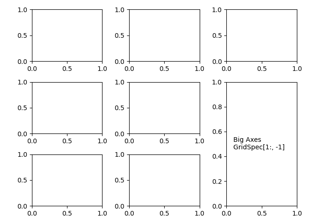
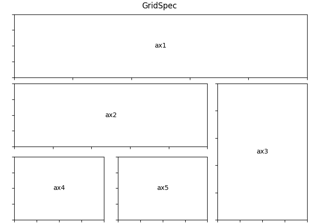
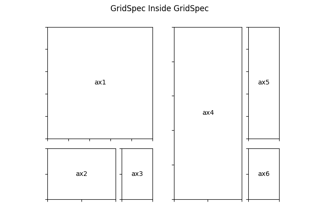
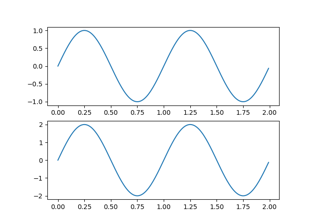
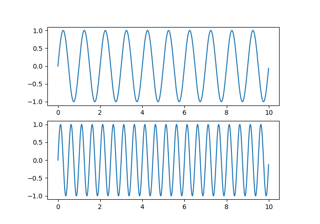
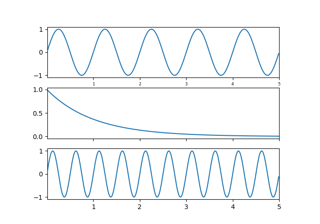
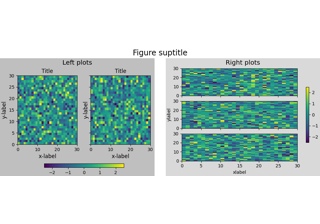
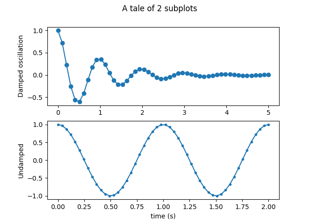
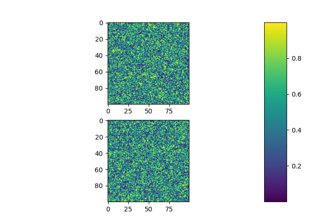
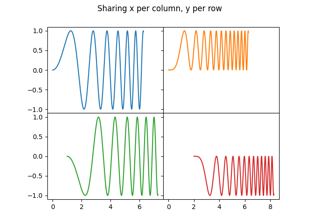
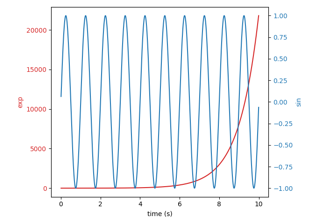
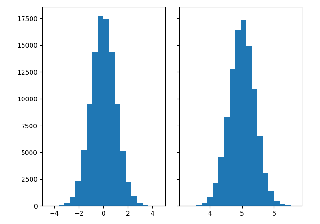
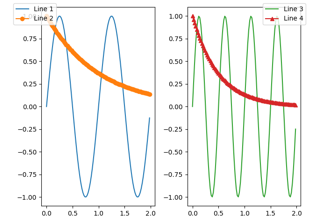
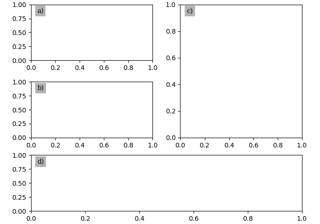
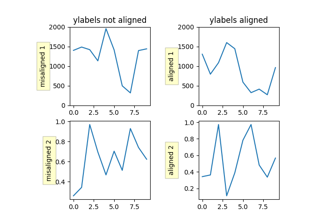
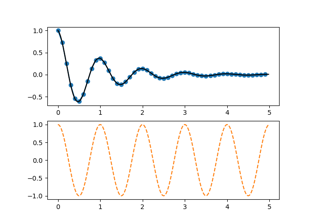
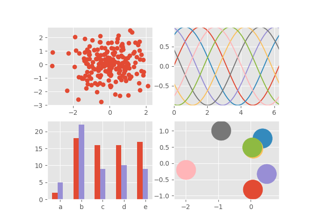
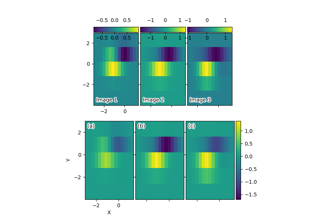
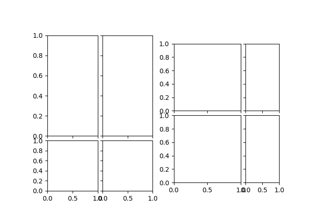
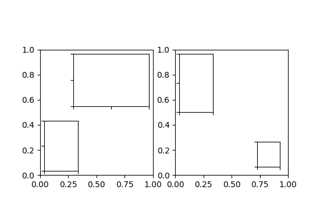
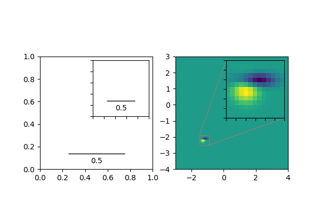
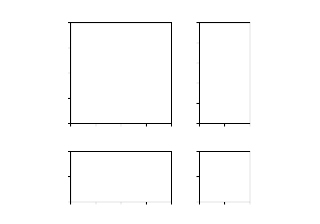
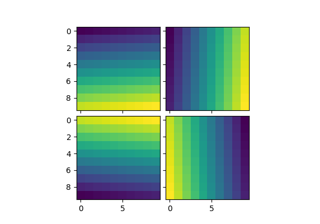
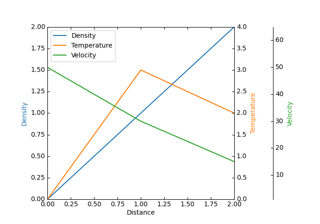
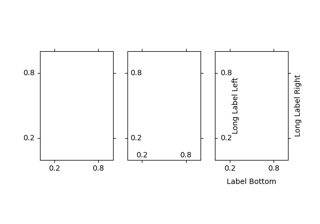
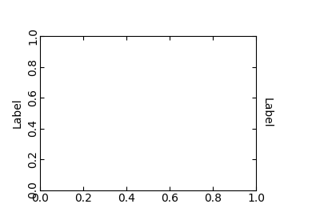
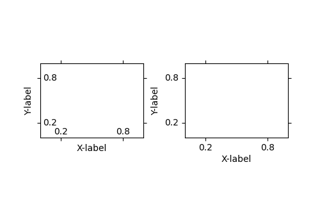
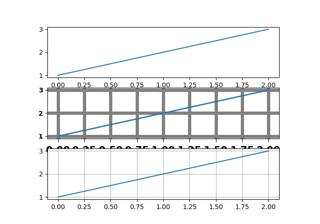
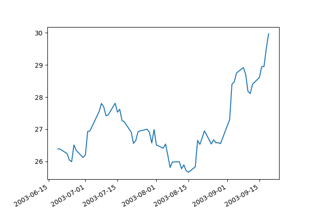
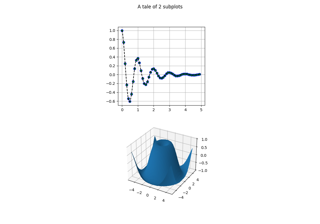
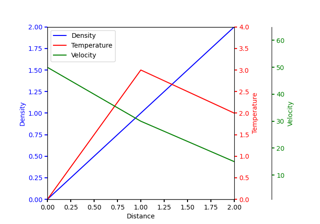
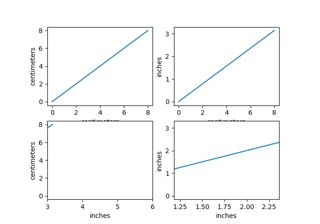
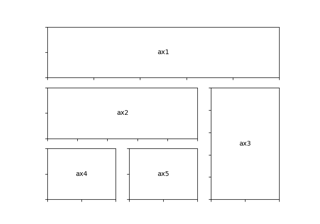
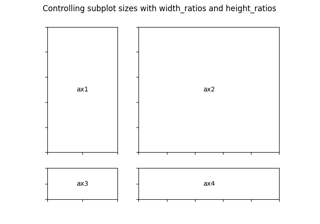
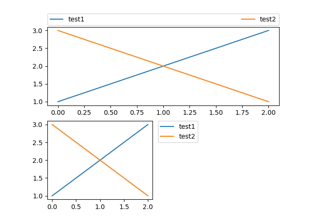
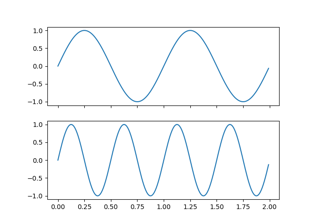
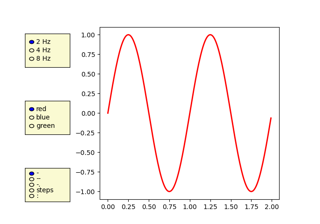
Subplots, axes and figures
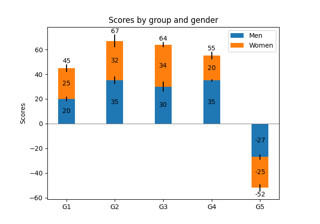
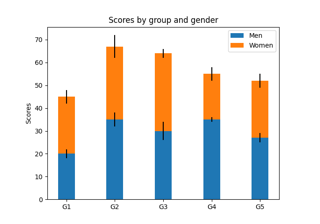
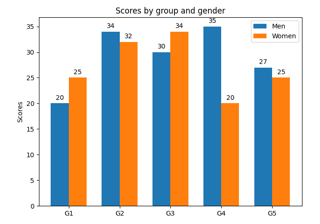
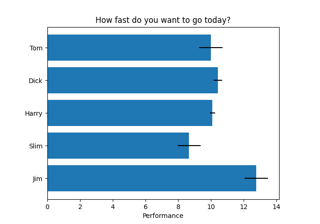
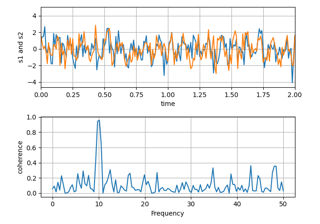
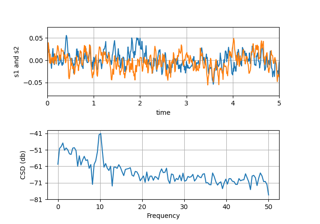
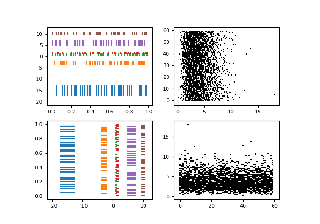
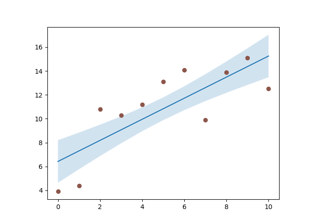
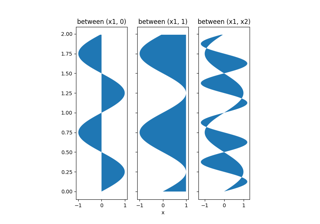
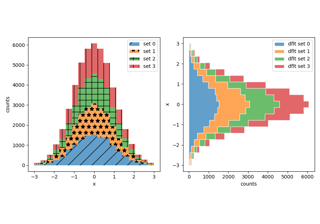
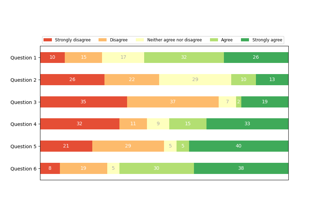
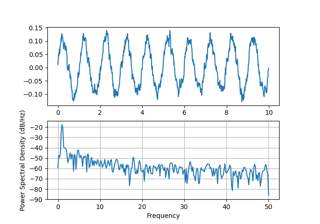
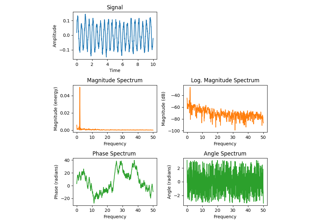
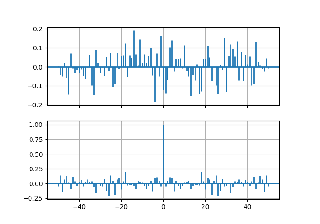
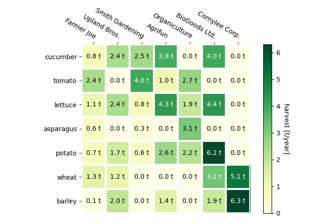
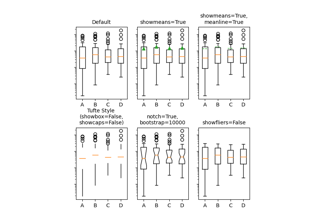
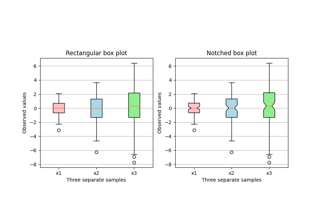
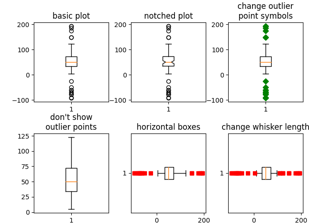
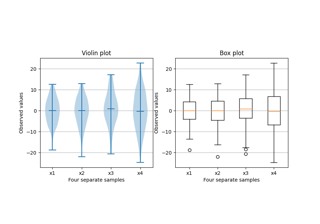
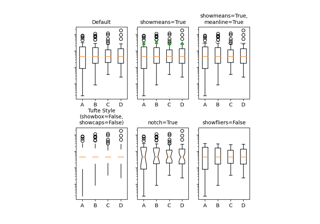
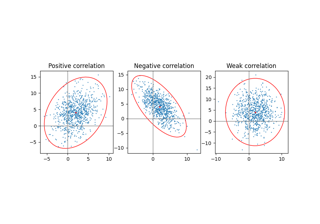
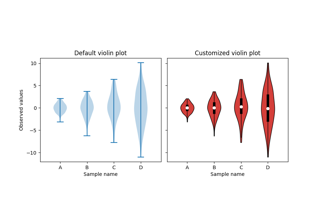
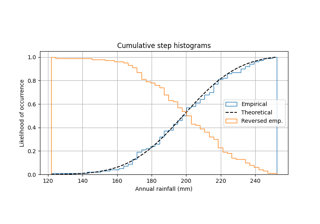
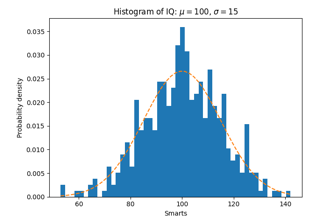
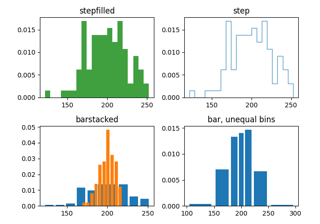
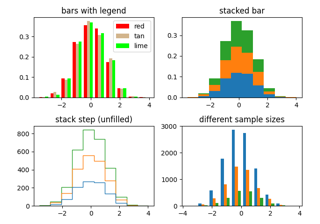
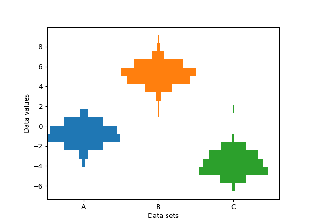
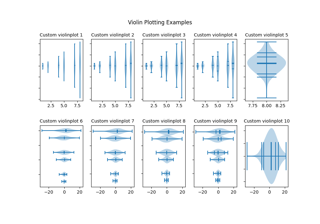
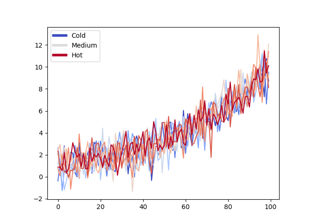
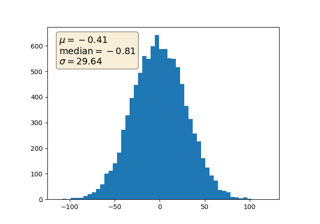
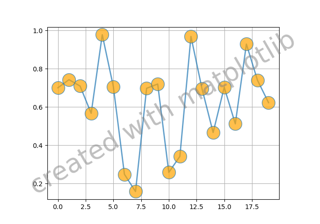
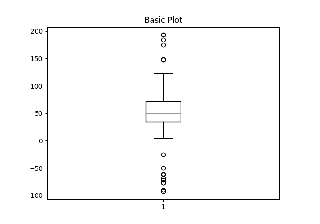
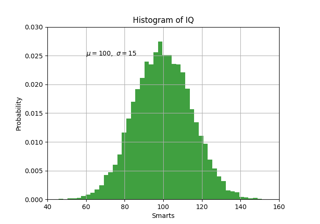
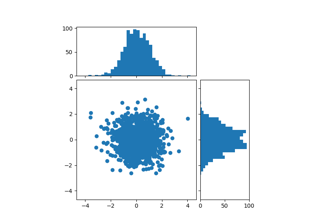
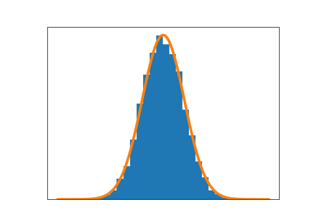
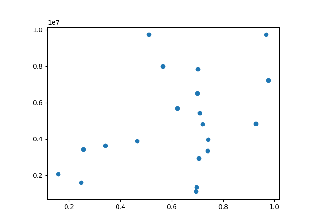
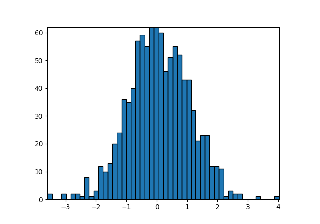
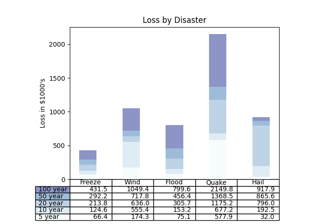
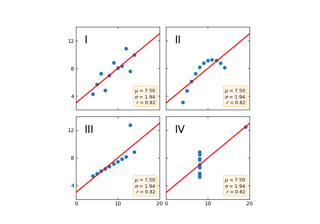
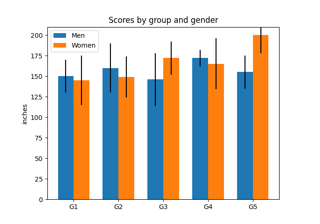
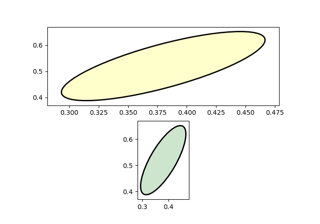
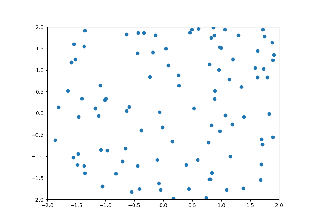
Statistics
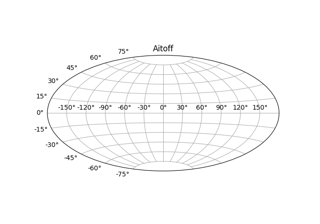
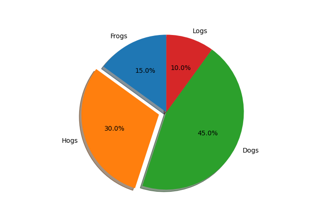
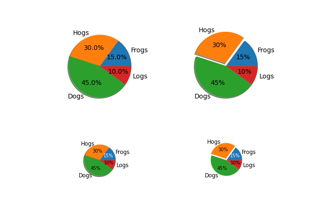
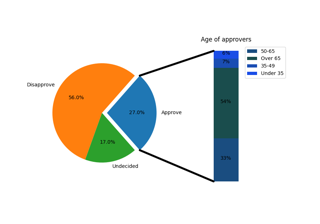
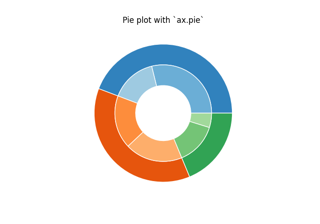
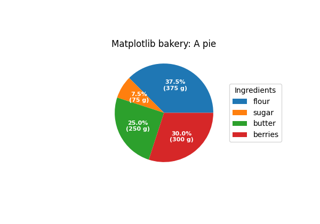
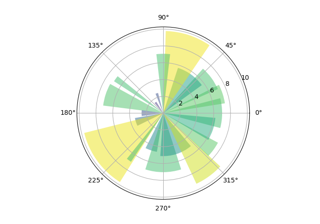
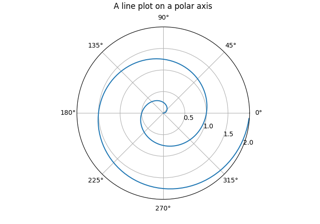
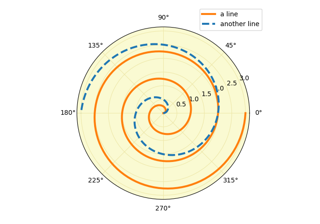
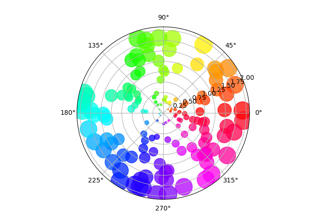
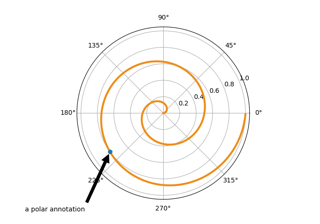
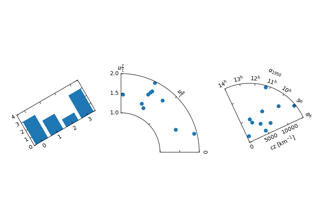
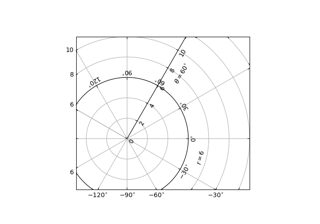
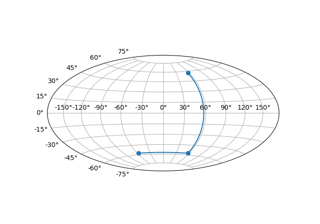
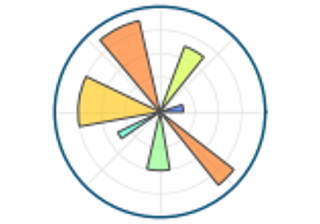
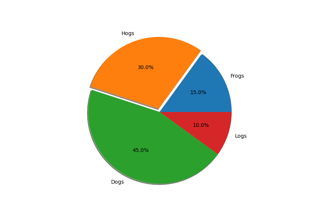
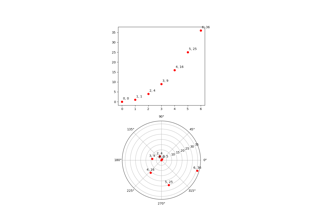
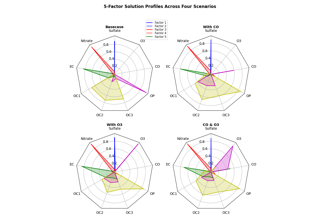
Pie and polar charts
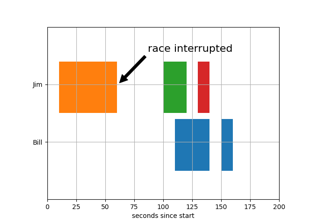
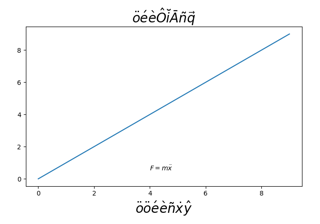
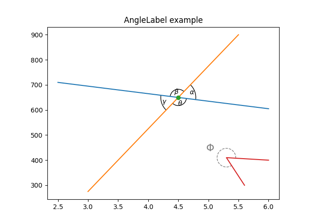
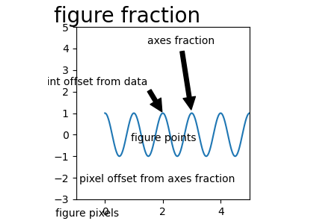
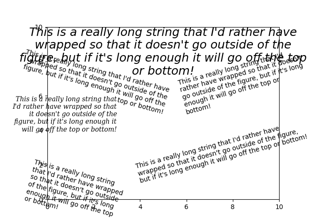
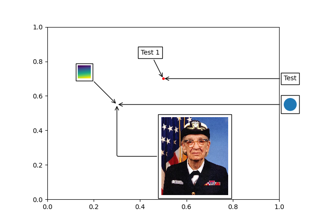
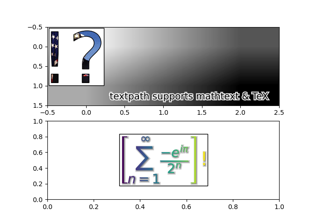
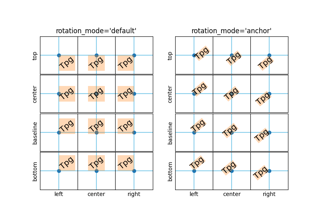
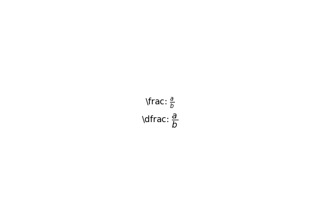
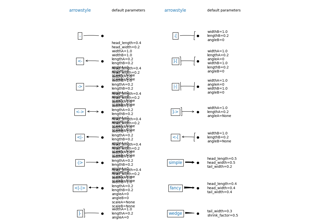
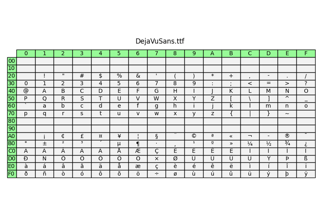
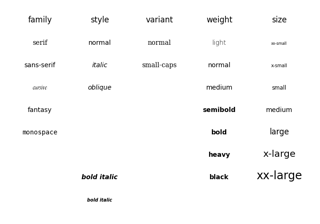
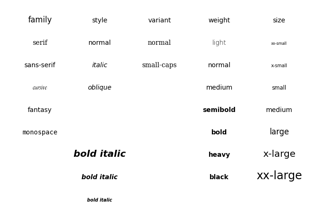
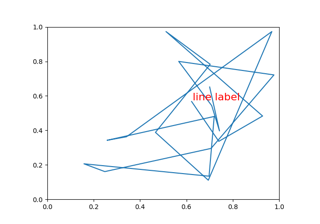
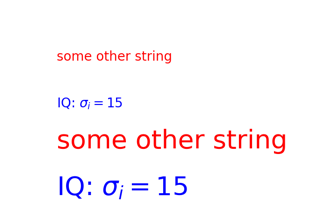
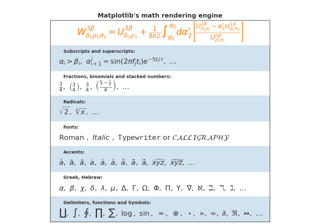
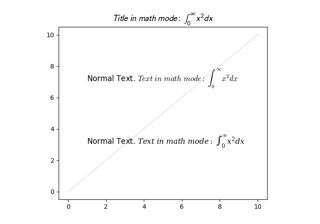
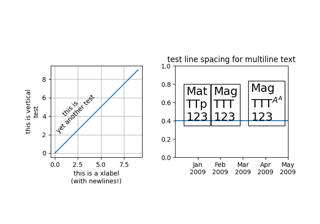
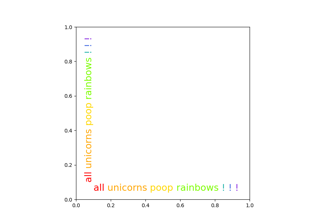
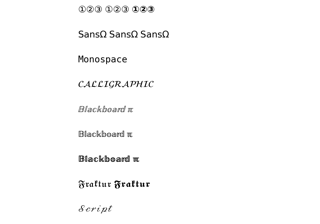
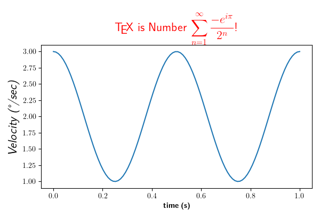
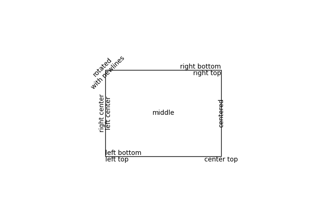
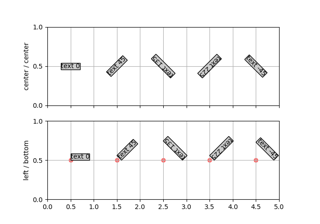
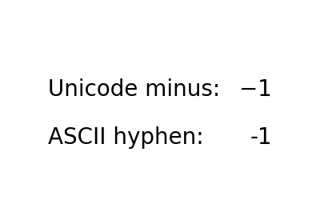
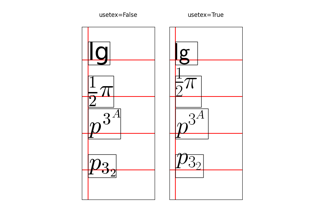
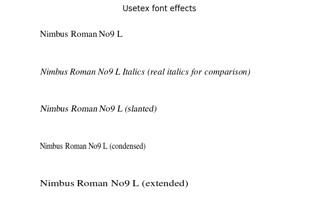
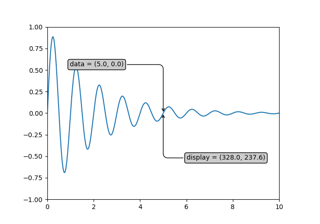
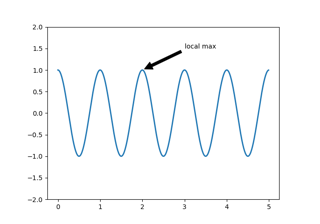
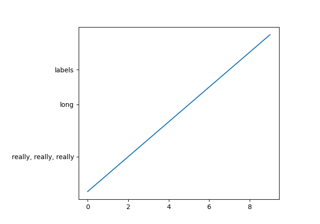
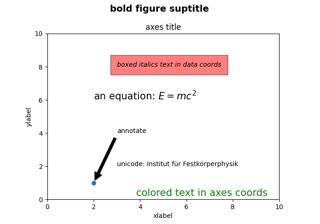
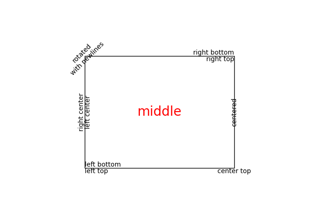
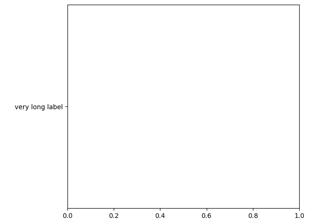
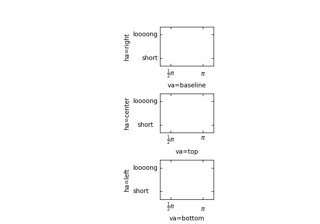
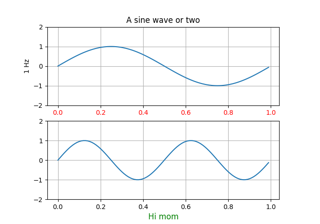
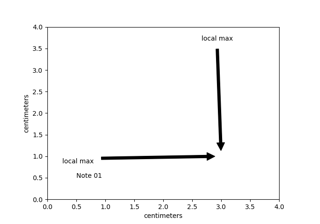
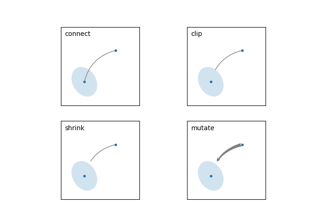
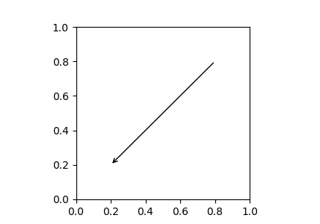
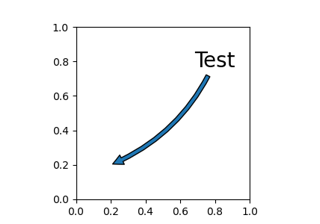
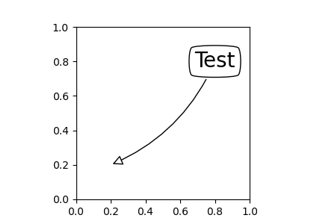
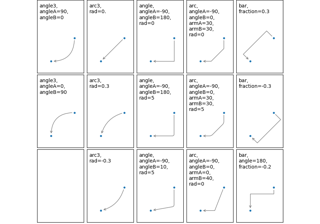
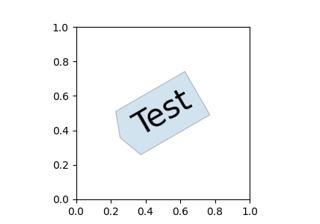
Text, labels and annotations

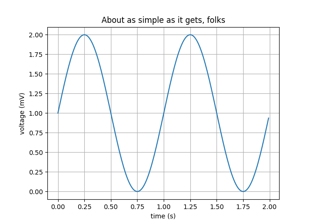
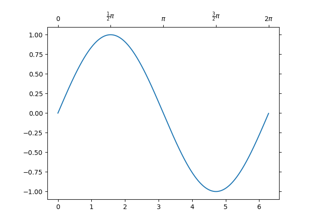
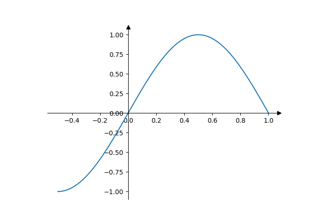
pyplot

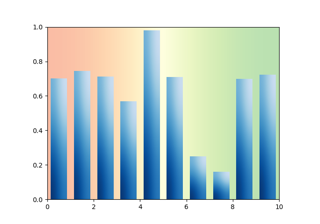
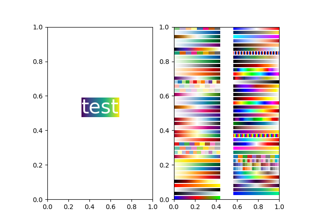
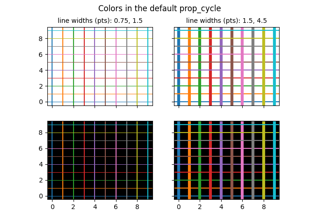
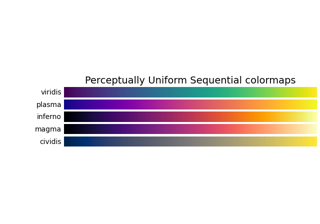
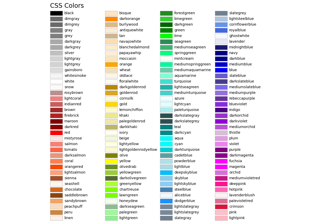
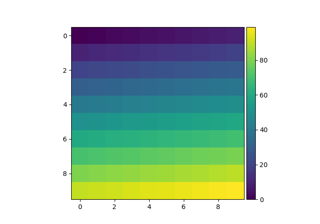
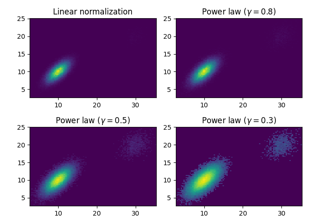
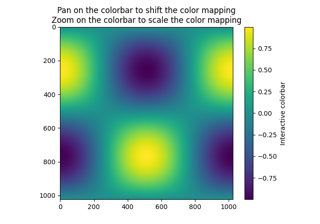
Color
For more in-depth information about the colormaps available in matplotlib as well as a description of their properties, see the colormaps tutorial.
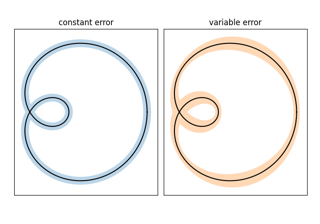
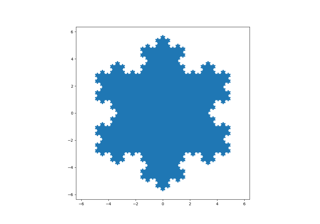
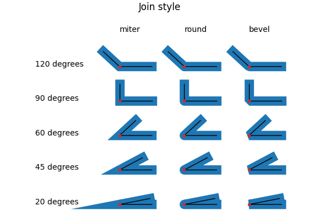
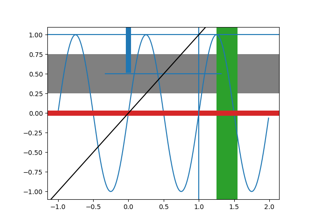
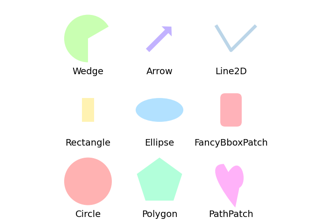
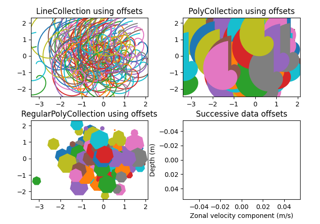
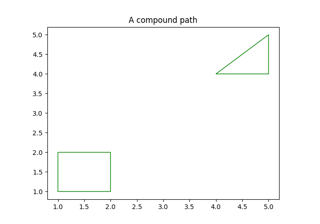
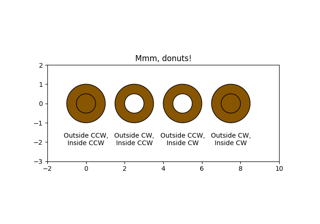
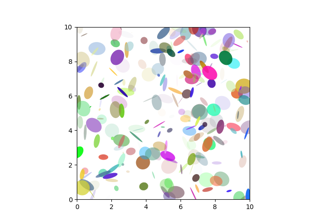
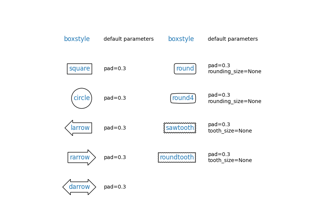
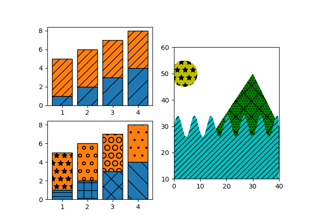
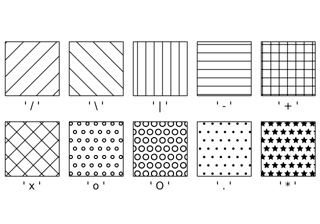
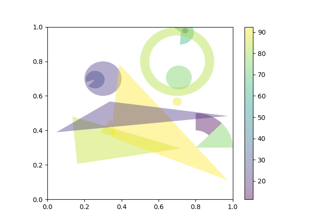
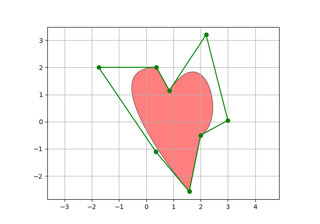
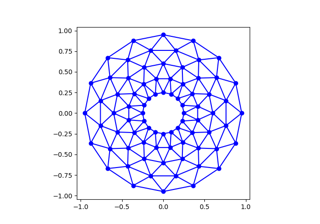
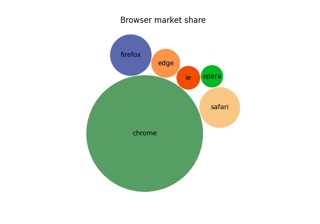
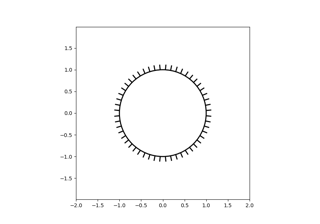
Shapes and collections
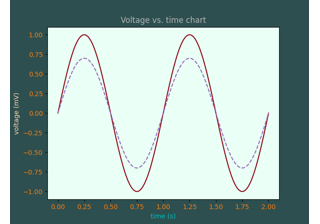
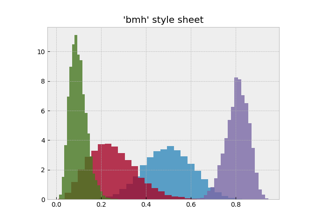
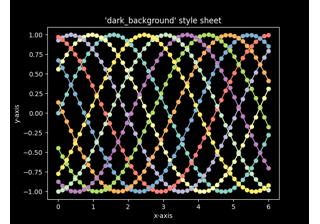
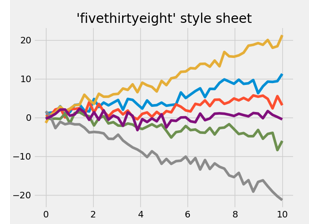
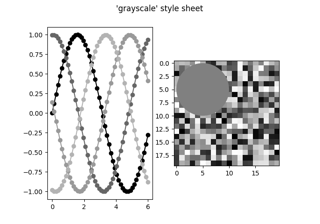
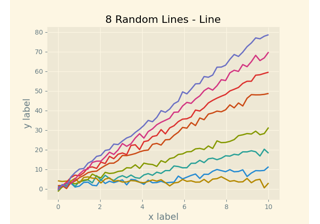
Style sheets
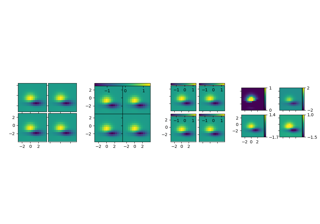
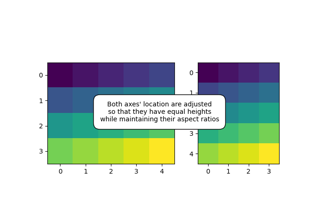
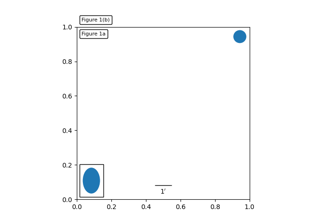
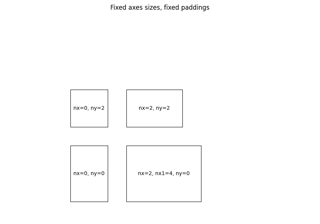
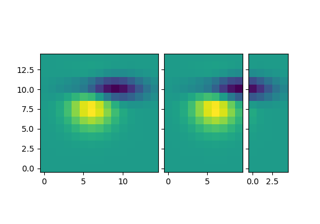
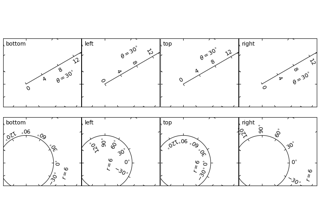
axes_grid1
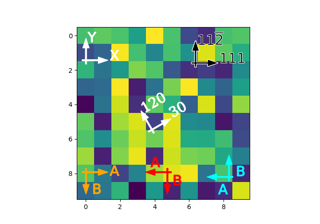
axisartist
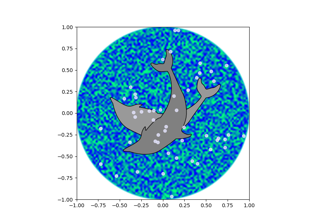
Showcase

Animation


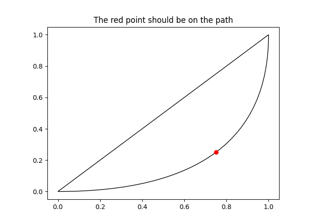
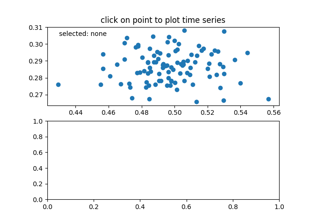
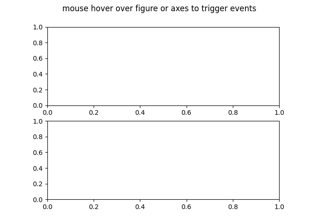
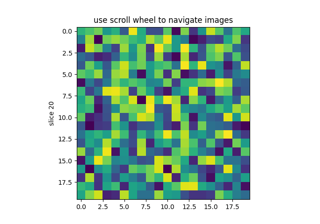
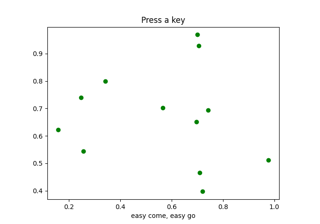
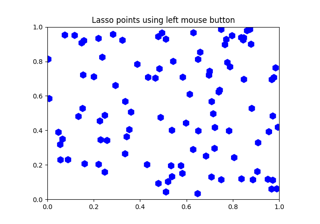
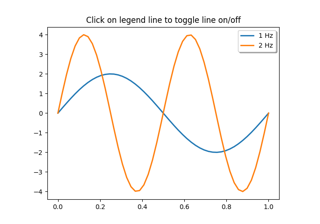
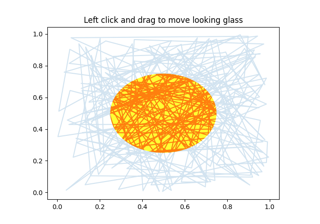
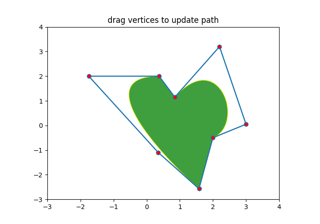
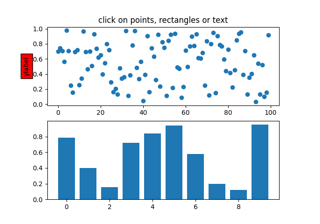
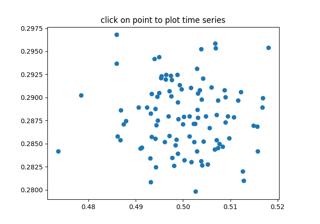
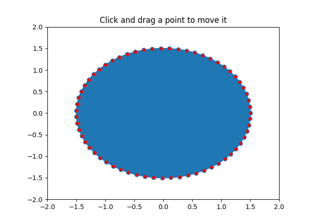
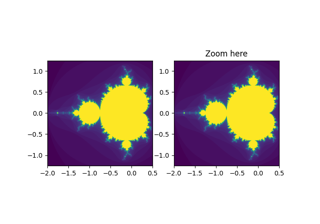
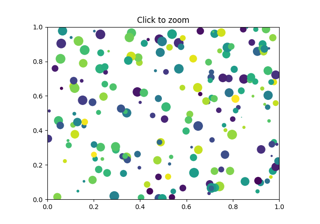
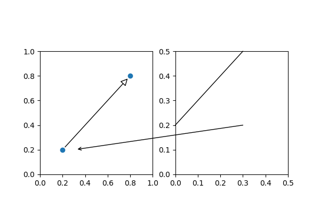
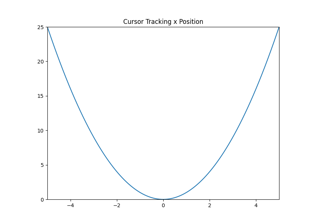
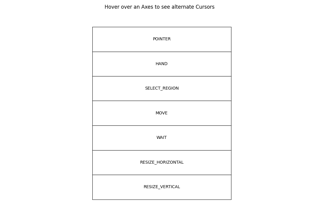
Event handling
Matplotlib supports event handling with a GUI neutral event model, so you can connect to Matplotlib events without knowledge of what user interface Matplotlib will ultimately be plugged in to. This has two advantages: the code you write will be more portable, and Matplotlib events are aware of things like data coordinate space and which axes the event occurs in so you don't have to mess with low level transformation details to go from canvas space to data space. Object picking examples are also included.


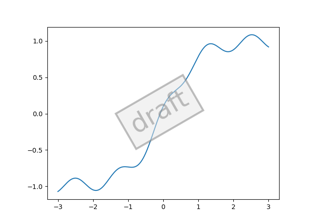
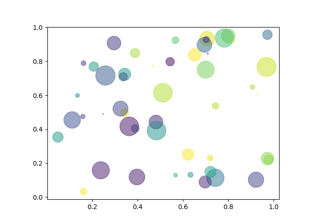
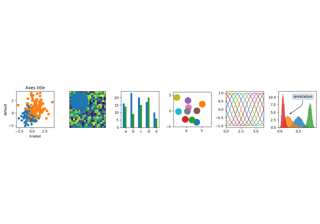
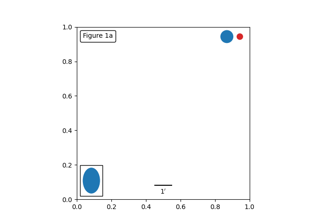
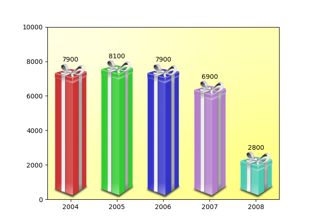
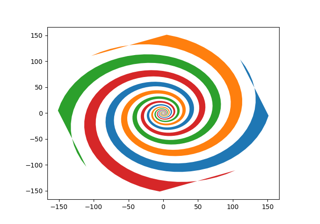
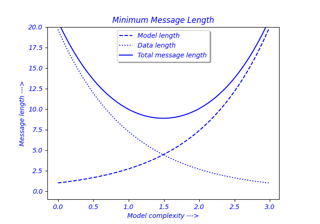
Front Page
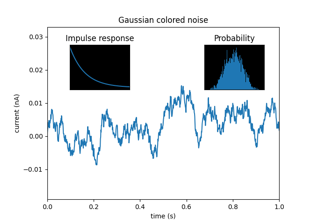
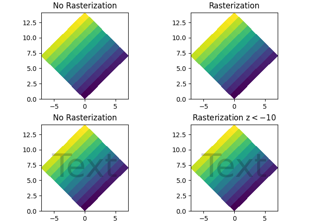
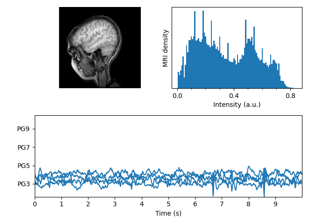
Miscellaneous


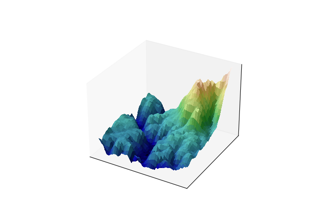
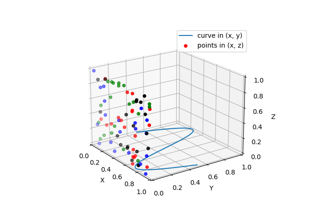
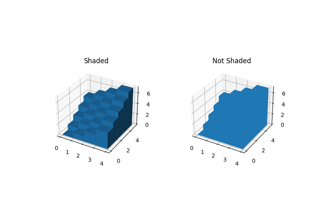
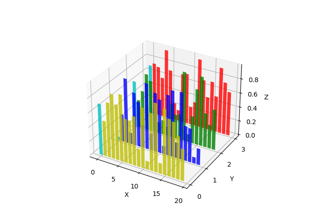
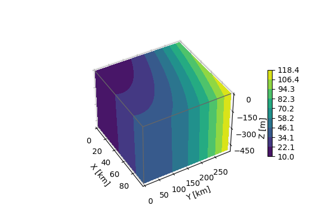
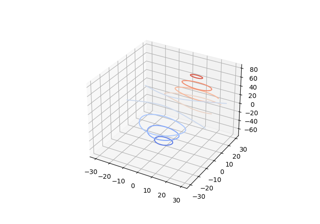
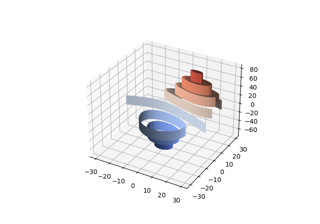
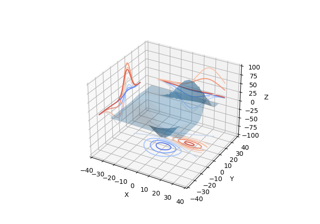
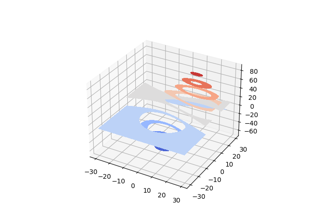
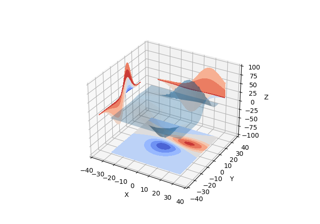
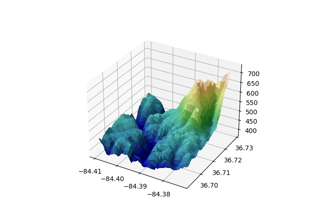
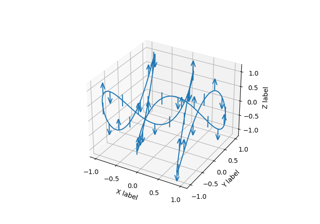
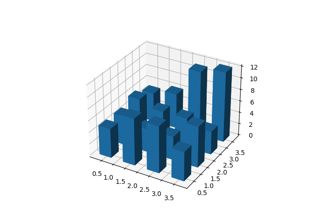
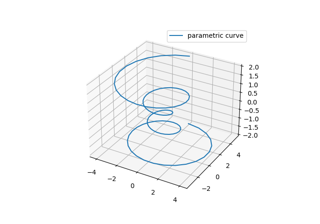
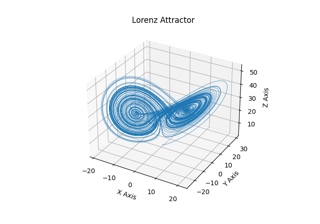
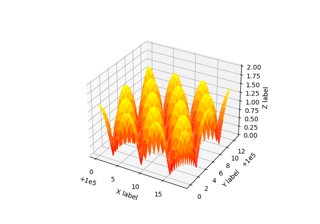
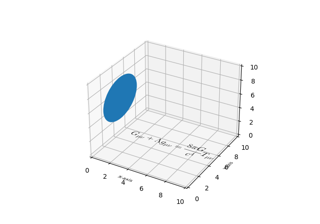
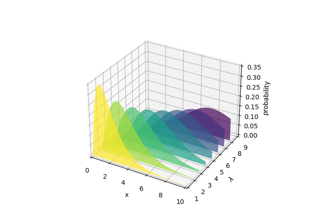
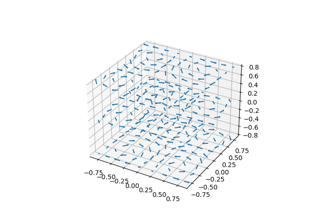
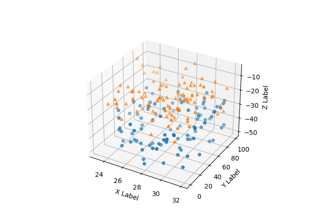
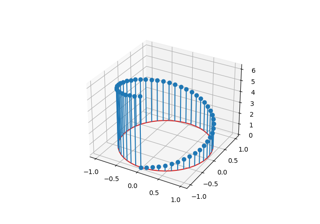
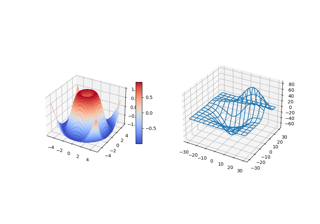
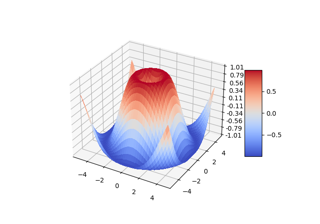
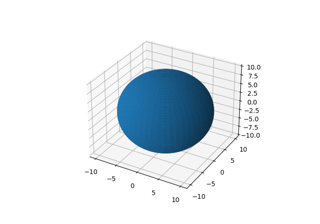
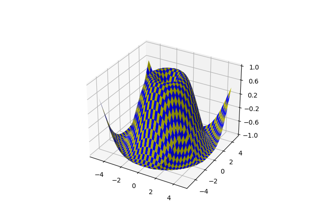
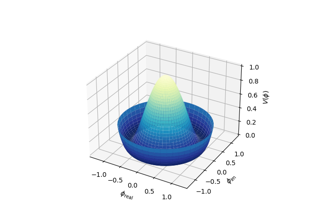
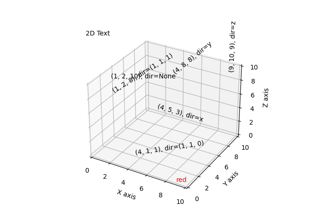
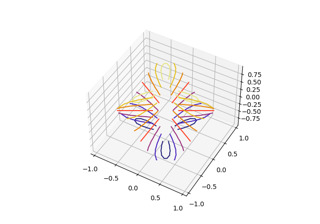
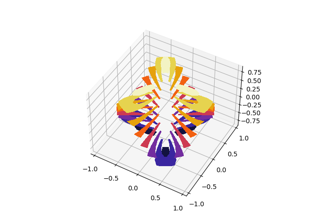
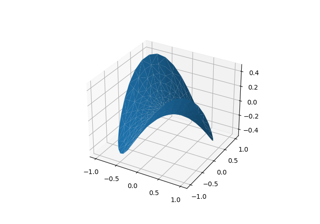
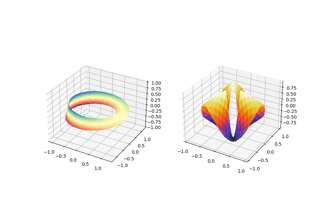
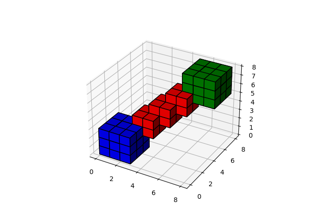
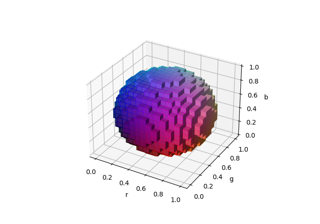
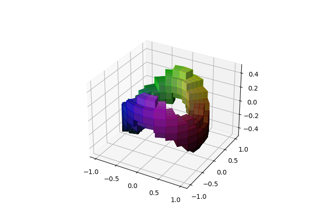
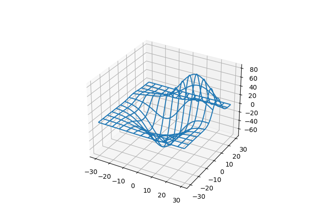
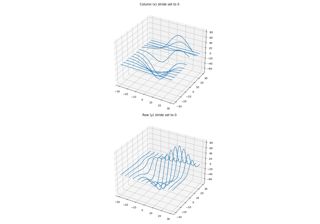
3D plotting


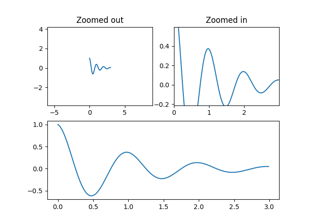
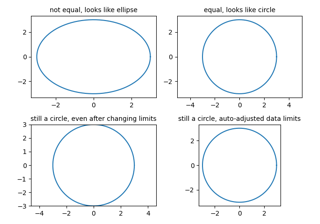
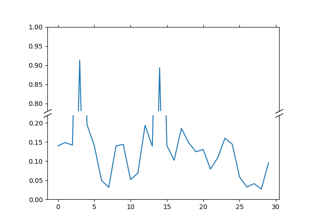
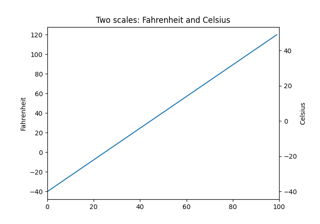
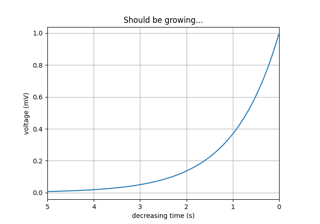
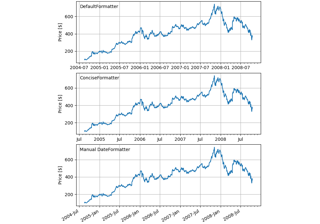
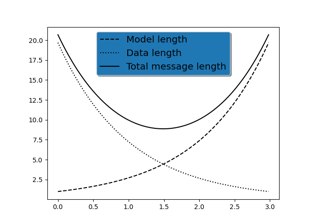
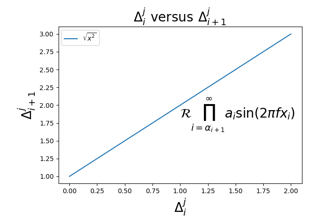
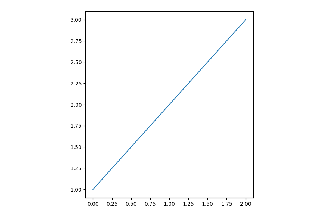
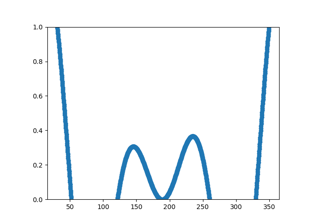
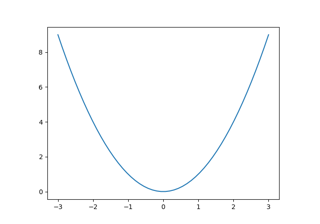
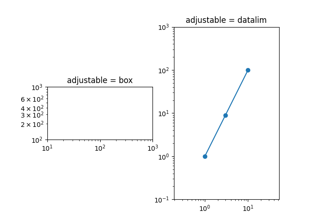
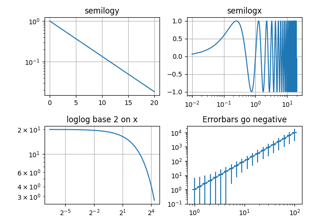
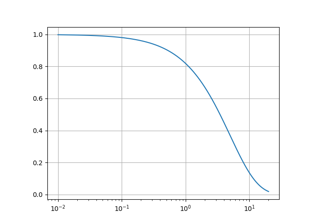
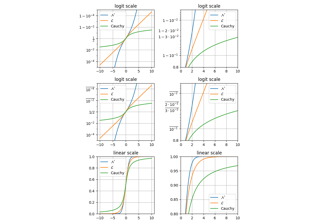
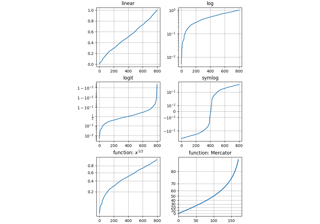
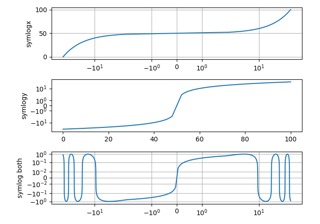
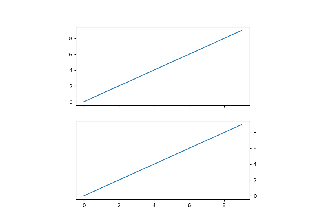
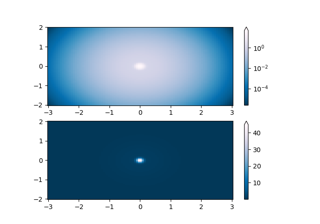
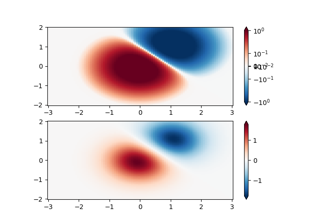
Scales
These examples cover how different scales are handled in Matplotlib.
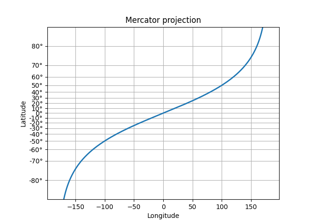
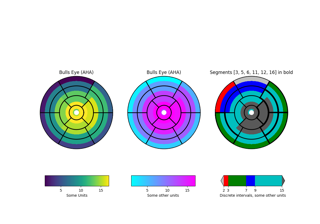
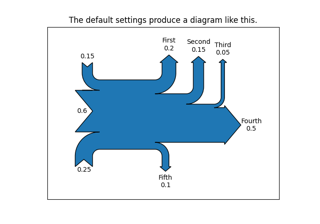
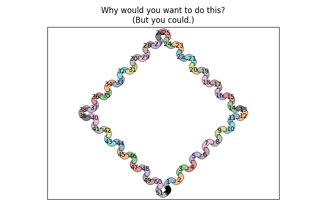
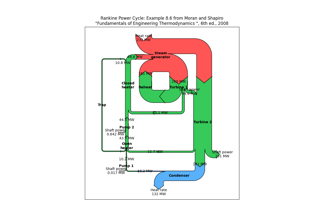
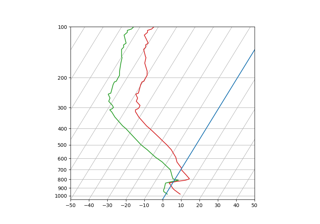
Specialty Plots

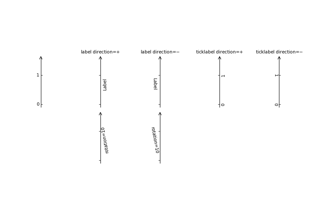
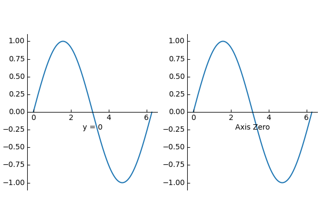
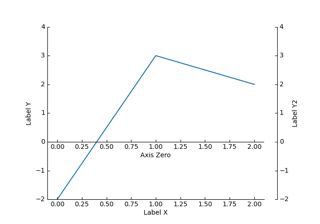
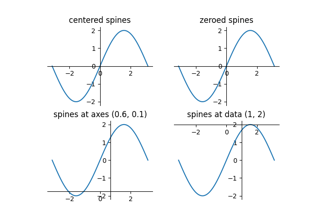
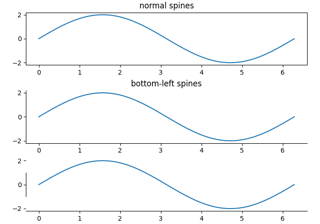
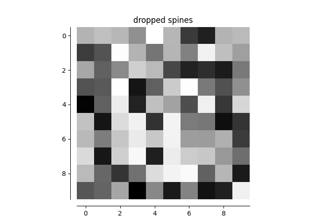
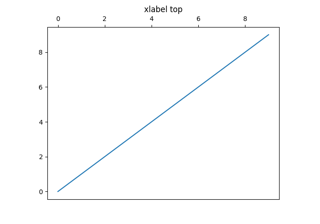
Spines
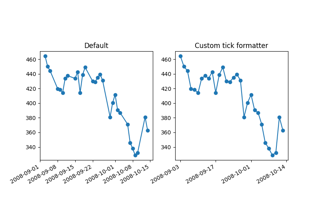
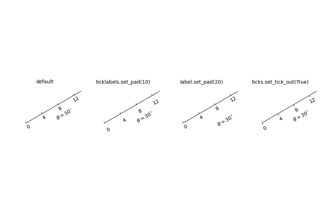
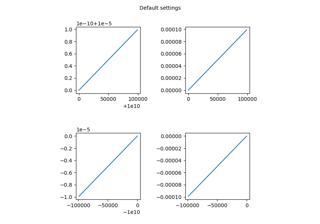
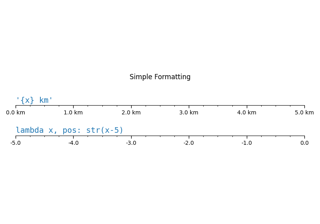
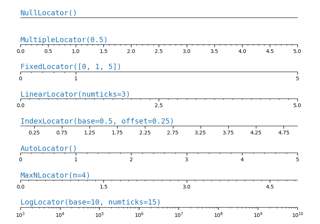
Ticks
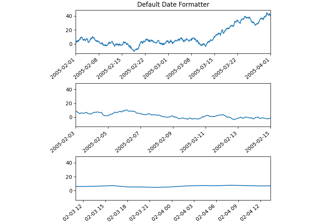
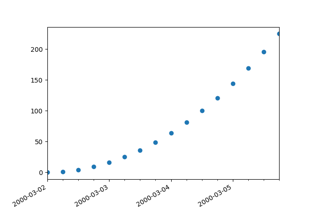
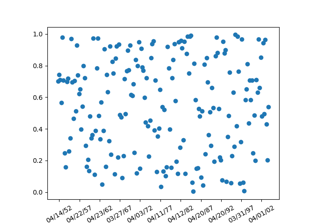
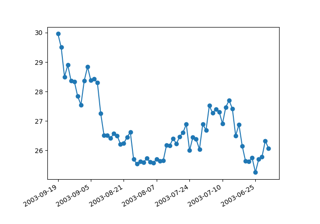
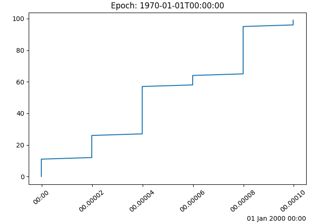
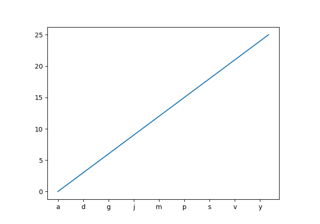
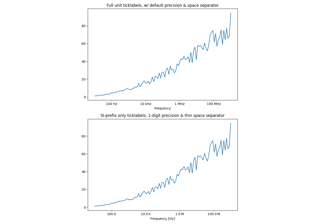
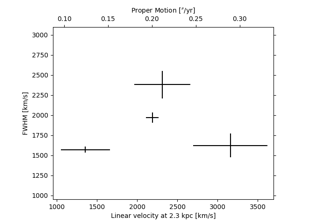
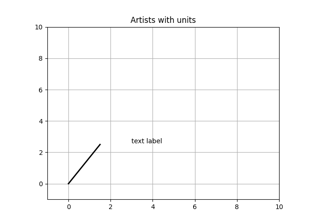
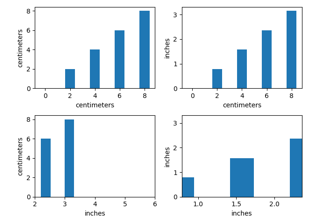
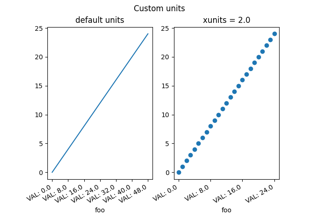
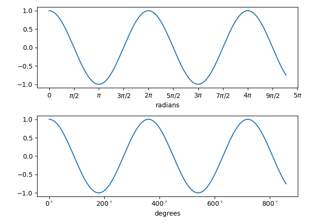
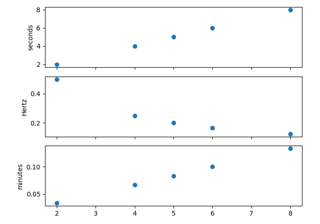
Units
These examples cover the many representations of units in Matplotlib.

Embedding Matplotlib in graphical user interfaces
You can embed Matplotlib directly into a user interface application by following the embedding_in_SOMEGUI.py examples here. Currently Matplotlib supports PyQt/PySide, PyGObject, Tkinter, and wxPython.
When embedding Matplotlib in a GUI, you must use the Matplotlib API directly rather than the pylab/pyplot proceedural interface, so take a look at the examples/api directory for some example code working with the API.


Userdemo

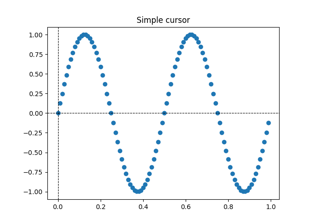
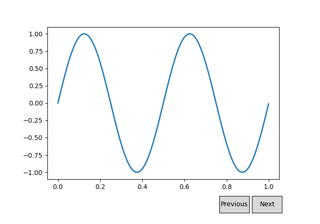
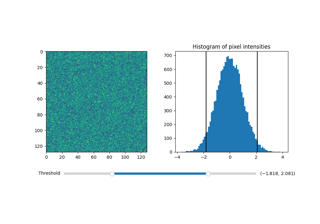
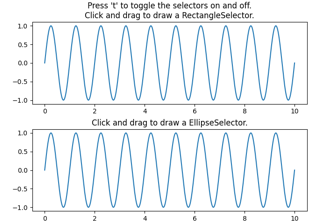
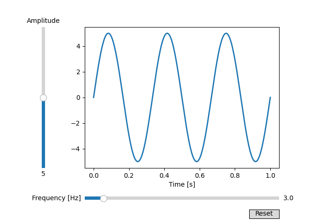
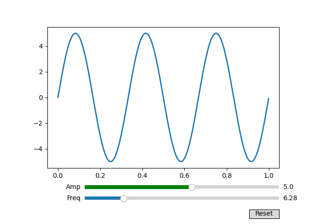
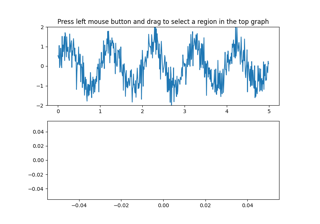
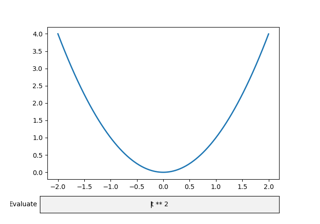
Widgets
Examples of how to write primitive, but GUI agnostic, widgets in matplotlib


Keywords: matplotlib code example, codex, python plot, pyplot Gallery generated by Sphinx-Gallery