Note
Click here to download the full example code
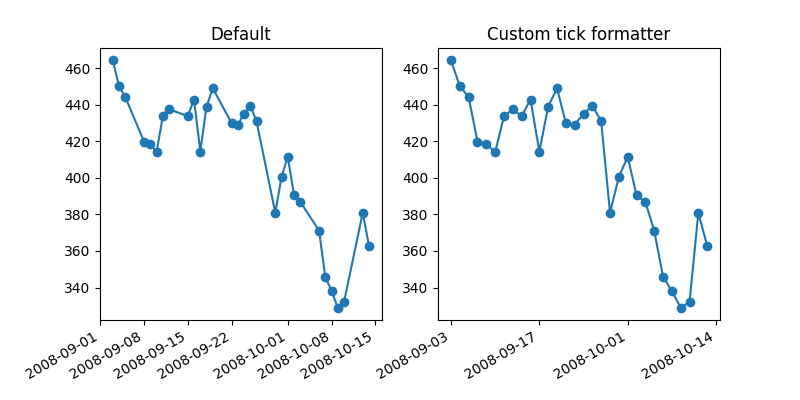
Custom tick formatter for time series
When plotting time series, e.g., financial time series, one often wants to leave out days on which there is no data, i.e. weekends. The example below shows how to use an 'index formatter' to achieve the desired plot
import numpy as np
import matplotlib.pyplot as plt
import matplotlib.cbook as cbook

# Load a numpy record array from yahoo csv data with fields date, open, close,
# volume, adj_close from the mpl-data/example directory. The record array
# stores the date as an np.datetime64 with a day unit ('D') in the date column.
r = (cbook.get_sample_data('goog.npz', np_load=True)['price_data']
     .view(np.recarray))
r = r[-30:]  # get the last 30 days

# first we'll do it the default way, with gaps on weekends
fig, (ax1, ax2) = plt.subplots(ncols=2, figsize=(8, 4))
ax1.plot(r.date, r.adj_close, 'o-')
ax1.set_title("Default")
fig.autofmt_xdate()

# next we'll write a custom formatter
N = len(r)
ind = np.arange(N)  # the evenly spaced plot indices


def format_date(x, pos=None):
    thisind = np.clip(int(x + 0.5), 0, N - 1)
    return r.date[thisind].item().strftime('%Y-%m-%d')


ax2.plot(ind, r.adj_close, 'o-')
# Use automatic FuncFormatter creation
ax2.xaxis.set_major_formatter(format_date)
ax2.set_title("Custom tick formatter")
fig.autofmt_xdate()

plt.show()
References
The use of the following functions, methods, classes and modules is shown in this example:
Keywords: matplotlib code example, codex, python plot, pyplot Gallery generated by Sphinx-Gallery