Note
Click here to download the full example code
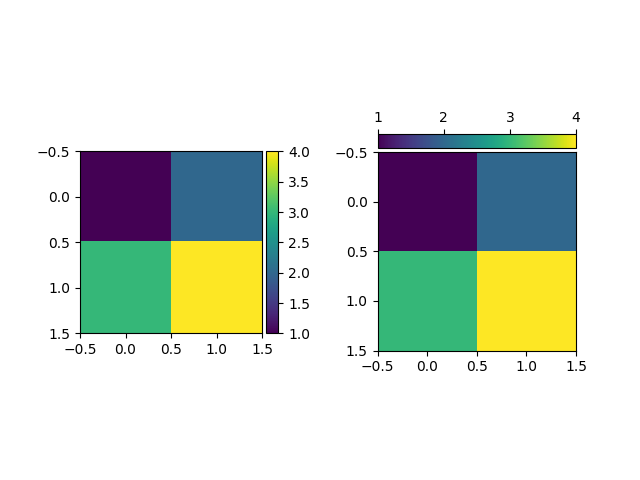
Colorbar with AxesDivider
The axes_divider.make_axes_locatable function takes an existing axes, adds
it to a new AxesDivider and returns the AxesDivider. The append_axes
method of the AxesDivider can then be used to create a new axes on a given
side ("top", "right", "bottom", or "left") of the original axes. This example
uses append_axes to add colorbars next to axes.
import matplotlib.pyplot as plt
from mpl_toolkits.axes_grid1.axes_divider import make_axes_locatable

fig, (ax1, ax2) = plt.subplots(1, 2)
fig.subplots_adjust(wspace=0.5)

im1 = ax1.imshow([[1, 2], [3, 4]])
ax1_divider = make_axes_locatable(ax1)
# Add an axes to the right of the main axes.
cax1 = ax1_divider.append_axes("right", size="7%", pad="2%")
cb1 = fig.colorbar(im1, cax=cax1)

im2 = ax2.imshow([[1, 2], [3, 4]])
ax2_divider = make_axes_locatable(ax2)
# Add an axes above the main axes.
cax2 = ax2_divider.append_axes("top", size="7%", pad="2%")
cb2 = fig.colorbar(im2, cax=cax2, orientation="horizontal")
# Change tick position to top (with the default tick position "bottom", ticks
# overlap the image).
cax2.xaxis.set_ticks_position("top")

plt.show()
Keywords: matplotlib code example, codex, python plot, pyplot Gallery generated by Sphinx-Gallery