Note
Click here to download the full example code
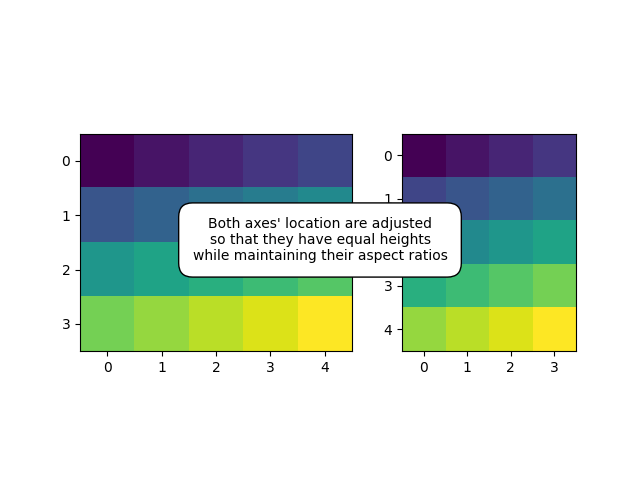
HBoxDivider demo
Using an HBoxDivider to arrange subplots.
import numpy as np
import matplotlib.pyplot as plt
from mpl_toolkits.axes_grid1.axes_divider import HBoxDivider
import mpl_toolkits.axes_grid1.axes_size as Size


def make_heights_equal(fig, rect, ax1, ax2, pad):
    # pad in inches
    divider = HBoxDivider(
        fig, rect,
        horizontal=[Size.AxesX(ax1), Size.Fixed(pad), Size.AxesX(ax2)],
        vertical=[Size.AxesY(ax1), Size.Scaled(1), Size.AxesY(ax2)])
    ax1.set_axes_locator(divider.new_locator(0))
    ax2.set_axes_locator(divider.new_locator(2))


if __name__ == "__main__":

    arr1 = np.arange(20).reshape((4, 5))
    arr2 = np.arange(20).reshape((5, 4))

    fig, (ax1, ax2) = plt.subplots(1, 2)
    ax1.imshow(arr1)
    ax2.imshow(arr2)

    make_heights_equal(fig, 111, ax1, ax2, pad=0.5)

    fig.text(.5, .5,
             "Both axes' location are adjusted\n"
             "so that they have equal heights\n"
             "while maintaining their aspect ratios",
             va="center", ha="center",
             bbox=dict(boxstyle="round, pad=1", facecolor="w"))

    plt.show()
Keywords: matplotlib code example, codex, python plot, pyplot Gallery generated by Sphinx-Gallery