mpl_toolkits.axes_grid1.axes_divider.HBoxDivider
- class mpl_toolkits.axes_grid1.axes_divider.HBoxDivider(fig, *args, horizontal=None, vertical=None, aspect=None, anchor='C')[source]
Bases:
mpl_toolkits.axes_grid1.axes_divider.SubplotDividerA
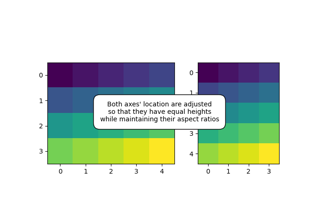
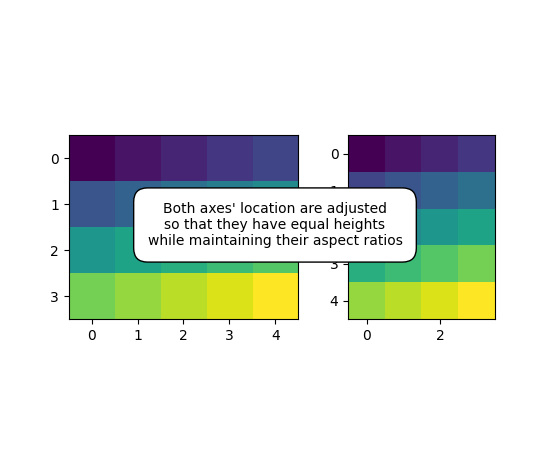
SubplotDividerfor laying out axes horizontally, while ensuring that they have equal heights.Examples
(Source code, png, pdf)

- Parameters
- fig
matplotlib.figure.Figure - *argstuple (nrows, ncols, index) or int
The array of subplots in the figure has dimensions
(nrows,
ncols)
, and index is the index of the subplot being created. index starts at 1 in the upper left corner and increases to the right.If nrows, ncols, and index are all single digit numbers, then args can be passed as a single 3-digit number (e.g. 234 for (2, 3, 4)).
- fig
- locate(nx, ny, nx1=None, ny1=None, axes=None, renderer=None)[source]
- Parameters
- nx, nx1int
Integers specifying the column-position of the cell. When nx1 is None, a single nx-th column is specified. Otherwise location of columns spanning between nx to nx1 (but excluding nx1-th column) is specified.
- ny, ny1int
Same as nx and nx1, but for row positions.
- axes
- renderer
- new_locator(nx, nx1=None)[source]
Create a new
AxesLocatorfor the specified cell.- Parameters
- nx, nx1int
Integers specifying the column-position of the cell. When nx1 is None, a single nx-th column is specified. Otherwise location of columns spanning between nx to nx1 (but excluding nx1-th column) is specified.