mpl_toolkits.axes_grid1.anchored_artists.AnchoredSizeBar
- class mpl_toolkits.axes_grid1.anchored_artists.AnchoredSizeBar(transform, size, label, loc, pad=0.1, borderpad=0.1, sep=2, frameon=True, size_vertical=0, color='black', label_top=False, fontproperties=None, fill_bar=None, **kwargs)[source]
Bases:
matplotlib.offsetbox.AnchoredOffsetboxDraw a horizontal scale bar with a center-aligned label underneath.
- Parameters
- transform
matplotlib.transforms.Transform The transformation object for the coordinate system in use, i.e.,
matplotlib.axes.Axes.transData.- sizefloat
Horizontal length of the size bar, given in coordinates of transform.
- labelstr
Label to display.
- locstr
Location of this ellipse. Valid locations are 'upper left', 'upper center', 'upper right', 'center left', 'center', 'center right', 'lower left', 'lower center, 'lower right'. For backward compatibility, numeric values are accepted as well. See the parameter loc of
Legendfor details.- padfloat, default: 0.1
Padding around the label and size bar, in fraction of the font size.
- borderpadfloat, default: 0.1
Border padding, in fraction of the font size.
- sepfloat, default: 2
Separation between the label and the size bar, in points.
- frameonbool, default: True
If True, draw a box around the horizontal bar and label.
- size_verticalfloat, default: 0
Vertical length of the size bar, given in coordinates of transform.
- colorstr, default: 'black'
Color for the size bar and label.
- label_topbool, default: False
If True, the label will be over the size bar.
- fontproperties
matplotlib.font_manager.FontProperties, optional Font properties for the label text.
- fill_barbool, optional
If True and if size_vertical is nonzero, the size bar will be filled in with the color specified by the size bar. Defaults to True if size_vertical is greater than zero and False otherwise.
- **kwargs
Keyword arguments forwarded to
AnchoredOffsetbox.
- transform
Notes
If prop is passed as a keyword argument, but fontproperties is not, then prop is be assumed to be the intended fontproperties. Using both prop and fontproperties is not supported.
Examples
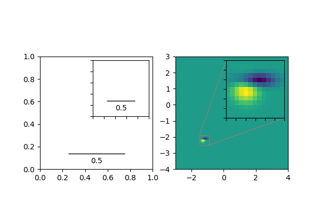
>>> import matplotlib.pyplot as plt
>>> import numpy as np
>>> from mpl_toolkits.axes_grid1.anchored_artists import (
...     AnchoredSizeBar)
>>> fig, ax = plt.subplots()
>>> ax.imshow(np.random.random((10, 10)))
>>> bar = AnchoredSizeBar(ax.transData, 3, '3 data units', 4)
>>> ax.add_artist(bar)
>>> fig.show()
Using all the optional parameters
>>> import matplotlib.font_manager as fm
>>> fontprops = fm.FontProperties(size=14, family='monospace')
>>> bar = AnchoredSizeBar(ax.transData, 3, '3 units', 4, pad=0.5,
...                       sep=5, borderpad=0.5, frameon=False,
...                       size_vertical=0.5, color='white',
...                       fontproperties=fontprops)
- Attributes
- size_bar
matplotlib.offsetbox.AuxTransformBox Container for the size bar.
- txt_label
matplotlib.offsetbox.TextArea Container for the label of the size bar.
- size_bar
- set(*, agg_filter=<UNSET>, alpha=<UNSET>, animated=<UNSET>, bbox_to_anchor=<UNSET>, child=<UNSET>, clip_box=<UNSET>, clip_on=<UNSET>, clip_path=<UNSET>, gid=<UNSET>, height=<UNSET>, in_layout=<UNSET>, label=<UNSET>, offset=<UNSET>, path_effects=<UNSET>, picker=<UNSET>, rasterized=<UNSET>, sketch_params=<UNSET>, snap=<UNSET>, transform=<UNSET>, url=<UNSET>, visible=<UNSET>, width=<UNSET>, zorder=<UNSET>)[source]
Set multiple properties at once.
Supported properties are
Property
Description
a filter function, which takes a (m, n, 3) float array and a dpi value, and returns a (m, n, 3) array
scalar or None
bool
unknown
unknown
bool
Patch or (Path, Transform) or None
str
float
bool
object
(float, float) or callable
None or bool or float or callable
bool
(scale: float, length: float, randomness: float)
bool or None
str
bool
float
float