matplotlib.axes.Axes.tripcolor
- Axes.tripcolor(*args, alpha=1.0, norm=None, cmap=None, vmin=None, vmax=None, shading='flat', facecolors=None, **kwargs)[source]
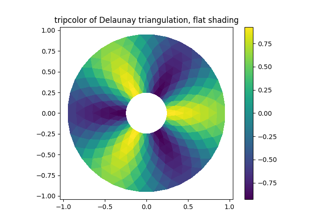
Create a pseudocolor plot of an unstructured triangular grid.
The triangulation can be specified in one of two ways; either:
tripcolor(triangulation, ...)
where triangulation is a
Triangulationobject, ortripcolor(x, y, ...) tripcolor(x, y, triangles, ...) tripcolor(x, y, triangles=triangles, ...) tripcolor(x, y, mask=mask, ...) tripcolor(x, y, triangles, mask=mask, ...)
in which case a Triangulation object will be created. See
Triangulationfor a explanation of these possibilities.The next argument must be C, the array of color values, either one per point in the triangulation if color values are defined at points, or one per triangle in the triangulation if color values are defined at triangles. If there are the same number of points and triangles in the triangulation it is assumed that color values are defined at points; to force the use of color values at triangles use the kwarg
facecolors=Cinstead of justC.shading may be 'flat' (the default) or 'gouraud'. If shading is 'flat' and C values are defined at points, the color values used for each triangle are from the mean C of the triangle's three points. If shading is 'gouraud' then color values must be defined at points.
The remaining kwargs are the same as for
pcolor.