matplotlib.pyplot.matshow
- matplotlib.pyplot.matshow(A, fignum=None, **kwargs)[source]
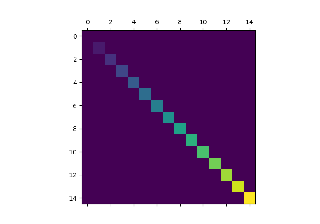
Display an array as a matrix in a new figure window.
The origin is set at the upper left hand corner and rows (first dimension of the array) are displayed horizontally. The aspect ratio of the figure window is that of the array, unless this would make an excessively short or narrow figure.
Tick labels for the xaxis are placed on top.
- Parameters
- A2D array-like
The matrix to be displayed.
- fignumNone or int or False
If None, create a new figure window with automatic numbering.
If a nonzero integer, draw into the figure with the given number (create it if it does not exist).
If 0, use the current axes (or create one if it does not exist).
Note
Because of how
Axes.matshowtries to set the figure aspect ratio to be the one of the array, strange things may happen if you reuse an existing figure.
- Returns
- Other Parameters
- **kwargs
imshowarguments
- **kwargs