matplotlib.axes.Axes.broken_barh
- Axes.broken_barh(xranges, yrange, *, data=None, **kwargs)[source]
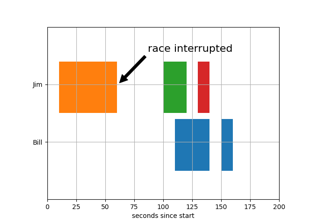
Plot a horizontal sequence of rectangles.
A rectangle is drawn for each element of xranges. All rectangles have the same vertical position and size defined by yrange.
This is a convenience function for instantiating a
BrokenBarHCollection, adding it to the Axes and autoscaling the view.- Parameters
- xrangessequence of tuples (xmin, xwidth)
The x-positions and extends of the rectangles. For each tuple (xmin, xwidth) a rectangle is drawn from xmin to xmin + xwidth.
- yrange(ymin, yheight)
The y-position and extend for all the rectangles.
- Returns
- Other Parameters
- dataindexable object, optional
If given, all parameters also accept a string
s, which is interpreted asdata[s](unless this raises an exception).- **kwargs
BrokenBarHCollectionproperties Each kwarg can be either a single argument applying to all rectangles, e.g.:
facecolors='black'
or a sequence of arguments over which is cycled, e.g.:
facecolors=('black', 'blue')
would create interleaving black and blue rectangles.
Supported keywords:
Property
Description
a filter function, which takes a (m, n, 3) float array and a dpi value, and returns a (m, n, 3) array
array-like or scalar or None
bool
antialiasedor aa or antialiasedsbool or list of bools
array-like or None
CapStyleor {'butt', 'projecting', 'round'}(vmin: float, vmax: float)
bool
Patch or (Path, Transform) or None
Colormapor str or Nonecolor or list of rgba tuples
edgecoloror ec or edgecolorscolor or list of colors or 'face'
facecoloror facecolors or fccolor or list of colors
str
{'/', '\', '|', '-', '+', 'x', 'o', 'O', '.', '*'}
bool
JoinStyleor {'miter', 'round', 'bevel'}object
linestyleor dashes or linestyles or lsstr or tuple or list thereof
linewidthor linewidths or lwfloat or list of floats
Normalizeor None(N, 2) or (2,) array-like
list of array-like
None or bool or float or callable
float
bool
sizesndarray or None
(scale: float, length: float, randomness: float)
bool or None
str
list of str or None
list of array-like
unknown
bool
float