matplotlib.colors.LightSource
- class matplotlib.colors.LightSource(azdeg=315, altdeg=45, hsv_min_val=0, hsv_max_val=1, hsv_min_sat=1, hsv_max_sat=0)[source]
Bases:
objectCreate a light source coming from the specified azimuth and elevation. Angles are in degrees, with the azimuth measured clockwise from north and elevation up from the zero plane of the surface.
shadeis used to produce "shaded" rgb values for a data array.shade_rgbcan be used to combine an rgb image with an elevation map.hillshadeproduces an illumination map of a surface.Specify the azimuth (measured clockwise from south) and altitude (measured up from the plane of the surface) of the light source in degrees.
- Parameters
- azdegfloat, default: 315 degrees (from the northwest)
The azimuth (0-360, degrees clockwise from North) of the light source.
- altdegfloat, default: 45 degrees
The altitude (0-90, degrees up from horizontal) of the light source.
Notes
For backwards compatibility, the parameters hsv_min_val, hsv_max_val, hsv_min_sat, and hsv_max_sat may be supplied at initialization as well. However, these parameters will only be used if "blend_mode='hsv'" is passed into
shadeorshade_rgb. See the documentation forblend_hsvfor more details.- blend_hsv(rgb, intensity, hsv_max_sat=None, hsv_max_val=None, hsv_min_val=None, hsv_min_sat=None)[source]
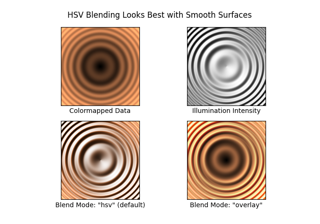
Take the input data array, convert to HSV values in the given colormap, then adjust those color values to give the impression of a shaded relief map with a specified light source. RGBA values are returned, which can then be used to plot the shaded image with imshow.
The color of the resulting image will be darkened by moving the (s, v) values (in hsv colorspace) toward (hsv_min_sat, hsv_min_val) in the shaded regions, or lightened by sliding (s, v) toward (hsv_max_sat, hsv_max_val) in regions that are illuminated. The default extremes are chose so that completely shaded points are nearly black (s = 1, v = 0) and completely illuminated points are nearly white (s = 0, v = 1).
- Parameters
- rgbndarray
An MxNx3 RGB array of floats ranging from 0 to 1 (color image).
- intensityndarray
An MxNx1 array of floats ranging from 0 to 1 (grayscale image).
- hsv_max_satnumber, default: 1
The maximum saturation value that the intensity map can shift the output image to.
- hsv_min_satnumber, optional
The minimum saturation value that the intensity map can shift the output image to. Defaults to 0.
- hsv_max_valnumber, optional
The maximum value ("v" in "hsv") that the intensity map can shift the output image to. Defaults to 1.
- hsv_min_valnumber, optional
The minimum value ("v" in "hsv") that the intensity map can shift the output image to. Defaults to 0.
- Returns
- ndarray
An MxNx3 RGB array representing the combined images.
- blend_overlay(rgb, intensity)[source]
Combine an rgb image with an intensity map using "overlay" blending.
- Parameters
- rgbndarray
An MxNx3 RGB array of floats ranging from 0 to 1 (color image).
- intensityndarray
An MxNx1 array of floats ranging from 0 to 1 (grayscale image).
- Returns
- ndarray
An MxNx3 RGB array representing the combined images.
- blend_soft_light(rgb, intensity)[source]
Combine an rgb image with an intensity map using "soft light" blending, using the "pegtop" formula.
- Parameters
- rgbndarray
An MxNx3 RGB array of floats ranging from 0 to 1 (color image).
- intensityndarray
An MxNx1 array of floats ranging from 0 to 1 (grayscale image).
- Returns
- ndarray
An MxNx3 RGB array representing the combined images.
- property direction
The unit vector direction towards the light source.
- hillshade(elevation, vert_exag=1, dx=1, dy=1, fraction=1.0)[source]
Calculate the illumination intensity for a surface using the defined azimuth and elevation for the light source.
This computes the normal vectors for the surface, and then passes them on to
shade_normals- Parameters
- elevation2D array-like
The height values used to generate an illumination map
- vert_exagnumber, optional
The amount to exaggerate the elevation values by when calculating illumination. This can be used either to correct for differences in units between the x-y coordinate system and the elevation coordinate system (e.g. decimal degrees vs. meters) or to exaggerate or de-emphasize topographic effects.
- dxnumber, optional
The x-spacing (columns) of the input elevation grid.
- dynumber, optional
The y-spacing (rows) of the input elevation grid.
- fractionnumber, optional
Increases or decreases the contrast of the hillshade. Values greater than one will cause intermediate values to move closer to full illumination or shadow (and clipping any values that move beyond 0 or 1). Note that this is not visually or mathematically the same as vertical exaggeration.
- Returns
- ndarray
A 2D array of illumination values between 0-1, where 0 is completely in shadow and 1 is completely illuminated.
- shade(data, cmap, norm=None, blend_mode='overlay', vmin=None, vmax=None, vert_exag=1, dx=1, dy=1, fraction=1, **kwargs)[source]
Combine colormapped data values with an illumination intensity map (a.k.a. "hillshade") of the values.
- Parameters
- data2D array-like
The height values used to generate a shaded map.
- cmap
Colormap The colormap used to color the data array. Note that this must be a
Colormapinstance. For example, rather than passing incmap='gist_earth', usecmap=plt.get_cmap('gist_earth')instead.- norm
Normalizeinstance, optional The normalization used to scale values before colormapping. If None, the input will be linearly scaled between its min and max.
- blend_mode{'hsv', 'overlay', 'soft'} or callable, optional
The type of blending used to combine the colormapped data values with the illumination intensity. Default is "overlay". Note that for most topographic surfaces, "overlay" or "soft" appear more visually realistic. If a user-defined function is supplied, it is expected to combine an MxNx3 RGB array of floats (ranging 0 to 1) with an MxNx1 hillshade array (also 0 to 1). (Call signature
func(rgb, illum, **kwargs)) Additional kwargs supplied to this function will be passed on to the blend_mode function.- vminfloat or None, optional
The minimum value used in colormapping data. If None the minimum value in data is used. If norm is specified, then this argument will be ignored.
- vmaxfloat or None, optional
The maximum value used in colormapping data. If None the maximum value in data is used. If norm is specified, then this argument will be ignored.
- vert_exagnumber, optional
The amount to exaggerate the elevation values by when calculating illumination. This can be used either to correct for differences in units between the x-y coordinate system and the elevation coordinate system (e.g. decimal degrees vs. meters) or to exaggerate or de-emphasize topography.
- dxnumber, optional
The x-spacing (columns) of the input elevation grid.
- dynumber, optional
The y-spacing (rows) of the input elevation grid.
- fractionnumber, optional
Increases or decreases the contrast of the hillshade. Values greater than one will cause intermediate values to move closer to full illumination or shadow (and clipping any values that move beyond 0 or 1). Note that this is not visually or mathematically the same as vertical exaggeration.
- Additional kwargs are passed on to the *blend_mode* function.
- Returns
- ndarray
An MxNx4 array of floats ranging between 0-1.
- shade_normals(normals, fraction=1.0)[source]
Calculate the illumination intensity for the normal vectors of a surface using the defined azimuth and elevation for the light source.
Imagine an artificial sun placed at infinity in some azimuth and elevation position illuminating our surface. The parts of the surface that slope toward the sun should brighten while those sides facing away should become darker.
- Parameters
- fractionnumber, optional
Increases or decreases the contrast of the hillshade. Values greater than one will cause intermediate values to move closer to full illumination or shadow (and clipping any values that move beyond 0 or 1). Note that this is not visually or mathematically the same as vertical exaggeration.
- Returns
- ndarray
A 2D array of illumination values between 0-1, where 0 is completely in shadow and 1 is completely illuminated.
- shade_rgb(rgb, elevation, fraction=1.0, blend_mode='hsv', vert_exag=1, dx=1, dy=1, **kwargs)[source]
Use this light source to adjust the colors of the rgb input array to give the impression of a shaded relief map with the given elevation.
- Parameters
- rgbarray-like
An (M, N, 3) RGB array, assumed to be in the range of 0 to 1.
- elevationarray-like
An (M, N) array of the height values used to generate a shaded map.
- fractionnumber
Increases or decreases the contrast of the hillshade. Values greater than one will cause intermediate values to move closer to full illumination or shadow (and clipping any values that move beyond 0 or 1). Note that this is not visually or mathematically the same as vertical exaggeration.
- blend_mode{'hsv', 'overlay', 'soft'} or callable, optional
The type of blending used to combine the colormapped data values with the illumination intensity. For backwards compatibility, this defaults to "hsv". Note that for most topographic surfaces, "overlay" or "soft" appear more visually realistic. If a user-defined function is supplied, it is expected to combine an MxNx3 RGB array of floats (ranging 0 to 1) with an MxNx1 hillshade array (also 0 to 1). (Call signature
func(rgb, illum, **kwargs)) Additional kwargs supplied to this function will be passed on to the blend_mode function.- vert_exagnumber, optional
The amount to exaggerate the elevation values by when calculating illumination. This can be used either to correct for differences in units between the x-y coordinate system and the elevation coordinate system (e.g. decimal degrees vs. meters) or to exaggerate or de-emphasize topography.
- dxnumber, optional
The x-spacing (columns) of the input elevation grid.
- dynumber, optional
The y-spacing (rows) of the input elevation grid.
- Additional kwargs are passed on to the *blend_mode* function.
- Returns
- ndarray
An (m, n, 3) array of floats ranging between 0-1.