matplotlib.mathtext
A module for parsing a subset of the TeX math syntax and rendering it to a Matplotlib backend.
For a tutorial of its usage, see Writing mathematical expressions. This document is primarily concerned with implementation details.
The module uses pyparsing to parse the TeX expression.
The Bakoma distribution of the TeX Computer Modern fonts, and STIX fonts are supported. There is experimental support for using arbitrary fonts, but results may vary without proper tweaking and metrics for those fonts.
- class matplotlib.mathtext.MathTextParser(output)[source]
Bases:
objectCreate a MathTextParser for the given backend output.
- get_depth(texstr, dpi=120, fontsize=14)[source]
[Deprecated] Get the depth of a mathtext string.
- Parameters
- texstrstr
A valid mathtext string, e.g., r'IQ: $sigma_i=15$'.
- dpifloat
The dots-per-inch setting used to render the text.
- Returns
- int
Offset of the baseline from the bottom of the image, in pixels.
Notes
Deprecated since version 3.4.
- parse(s, dpi=72, prop=None, *, _force_standard_ps_fonts=False)[source]
Parse the given math expression s at the given dpi. If prop is provided, it is a
FontPropertiesobject specifying the "default" font to use in the math expression, used for all non-math text.The results are cached, so multiple calls to
parsewith the same expression should be fast.
- to_mask(texstr, dpi=120, fontsize=14)[source]
[Deprecated] Convert a mathtext string to a grayscale array and depth.
- Parameters
- texstrstr
A valid mathtext string, e.g., r'IQ: $sigma_i=15$'.
- dpifloat
The dots-per-inch setting used to render the text.
- fontsizeint
The font size in points
- Returns
- array2D uint8 alpha
Mask array of rasterized tex.
- depthint
Offset of the baseline from the bottom of the image, in pixels.
Notes
Deprecated since version 3.4.
- to_png(filename, texstr, color='black', dpi=120, fontsize=14)[source]
[Deprecated] Render a tex expression to a PNG file.
- Parameters
- filename
A writable filename or fileobject.
- texstrstr
A valid mathtext string, e.g., r'IQ: $sigma_i=15$'.
- colorcolor
The text color.
- dpifloat
The dots-per-inch setting used to render the text.
- fontsizeint
The font size in points.
- Returns
- int
Offset of the baseline from the bottom of the image, in pixels.
Notes
Deprecated since version 3.4.
- to_rgba(texstr, color='black', dpi=120, fontsize=14)[source]
[Deprecated] Convert a mathtext string to an RGBA array and depth.
- Parameters
- texstrstr
A valid mathtext string, e.g., r'IQ: $sigma_i=15$'.
- colorcolor
The text color.
- dpifloat
The dots-per-inch setting used to render the text.
- fontsizeint
The font size in points.
- Returns
- array(M, N, 4) array
RGBA color values of rasterized tex, colorized with color.
- depthint
Offset of the baseline from the bottom of the image, in pixels.
Notes
Deprecated since version 3.4.
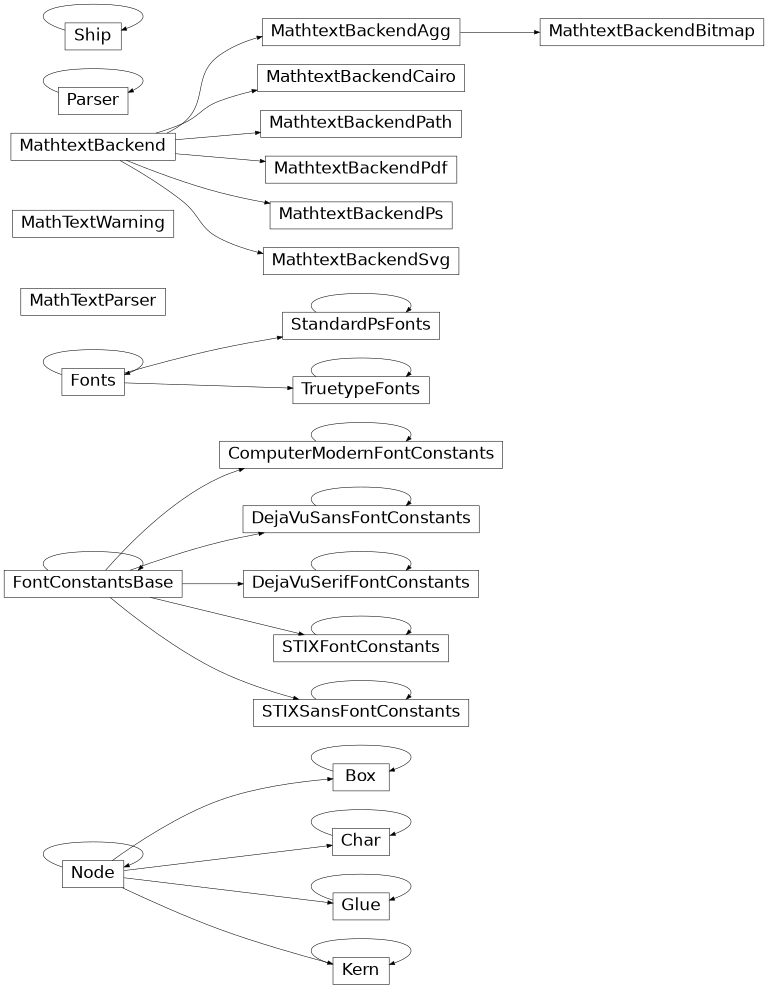
- class matplotlib.mathtext.MathtextBackend[source]
Bases:
objectThe base class for the mathtext backend-specific code.
MathtextBackendsubclasses interface between mathtext and specific Matplotlib graphics backends.Subclasses need to override the following:
And optionally, if you need to use a FreeType hinting style:
- get_results(box)[source]
Return a backend-specific tuple to return to the backend after all processing is done.
- class matplotlib.mathtext.MathtextBackendAgg[source]
Bases:
matplotlib.mathtext.MathtextBackendRender glyphs and rectangles to an FTImage buffer, which is later transferred to the Agg image by the Agg backend.
- get_results(box, used_characters)[source]
Return a backend-specific tuple to return to the backend after all processing is done.
- class matplotlib.mathtext.MathtextBackendBitmap[source]
Bases:
matplotlib.mathtext.MathtextBackendAgg[Deprecated]
Notes
Deprecated since version 3.4:
- class matplotlib.mathtext.MathtextBackendCairo[source]
Bases:
matplotlib.mathtext.MathtextBackend[Deprecated] Store information to write a mathtext rendering to the Cairo backend.
Notes
Deprecated since version 3.4.
- class matplotlib.mathtext.MathtextBackendPath[source]
Bases:
matplotlib.mathtext.MathtextBackendStore information to write a mathtext rendering to the text path machinery.
- class matplotlib.mathtext.MathtextBackendPdf[source]
Bases:
matplotlib.mathtext.MathtextBackend[Deprecated] Store information to write a mathtext rendering to the PDF backend.
Notes
Deprecated since version 3.4.
- class matplotlib.mathtext.MathtextBackendPs[source]
Bases:
matplotlib.mathtext.MathtextBackend[Deprecated] Store information to write a mathtext rendering to the PostScript backend.
Notes
Deprecated since version 3.4.
- class matplotlib.mathtext.MathtextBackendSvg[source]
Bases:
matplotlib.mathtext.MathtextBackend[Deprecated] Store information to write a mathtext rendering to the SVG backend.
Notes
Deprecated since version 3.4.
- matplotlib.mathtext.get_unicode_index(symbol, math=True)[source]
Return the integer index (from the Unicode table) of symbol.
- Parameters
- symbolstr
A single unicode character, a TeX command (e.g. r'pi') or a Type1 symbol name (e.g. 'phi').
- mathbool, default: True
If False, always treat as a single unicode character.
- matplotlib.mathtext.math_to_image(s, filename_or_obj, prop=None, dpi=None, format=None)[source]
Given a math expression, renders it in a closely-clipped bounding box to an image file.
- Parameters
- sstr
A math expression. The math portion must be enclosed in dollar signs.
- filename_or_objstr or path-like or file-like
Where to write the image data.
- prop
FontProperties, optional The size and style of the text.
- dpifloat, optional
The output dpi. If not set, the dpi is determined as for
Figure.savefig.- formatstr, optional
The output format, e.g., 'svg', 'pdf', 'ps' or 'png'. If not set, the format is determined as for
Figure.savefig.