matplotlib.colors.SymLogNorm
- class matplotlib.colors.SymLogNorm(linthresh, linscale=1.0, vmin=None, vmax=None, clip=False, *, base=10)[source]
Bases:
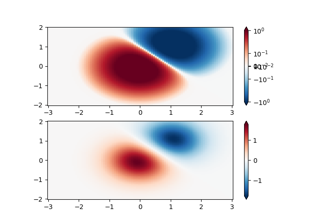
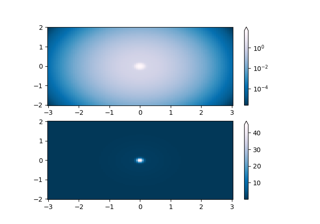
matplotlib.colors.SymLogNormThe symmetrical logarithmic scale is logarithmic in both the positive and negative directions from the origin.
Since the values close to zero tend toward infinity, there is a need to have a range around zero that is linear. The parameter linthresh allows the user to specify the size of this range (-linthresh, linthresh).
- Parameters
- linthreshfloat
The range within which the plot is linear (to avoid having the plot go to infinity around zero).
- linscalefloat, default: 1
This allows the linear range (-linthresh to linthresh) to be stretched relative to the logarithmic range. Its value is the number of decades to use for each half of the linear range. For example, when linscale == 1.0 (the default), the space used for the positive and negative halves of the linear range will be equal to one decade in the logarithmic range.
- basefloat, default: 10
- Parameters
- vmin, vmaxfloat or None
If vmin and/or vmax is not given, they are initialized from the minimum and maximum value, respectively, of the first input processed; i.e.,
__call__(A)callsautoscale_None(A).- clipbool, default: False
If
Truevalues falling outside the range[vmin, vmax], are mapped to 0 or 1, whichever is closer, and masked values are set to 1. IfFalsemasked values remain masked.Clipping silently defeats the purpose of setting the over, under, and masked colors in a colormap, so it is likely to lead to surprises; therefore the default is
clip=False.
Notes
Returns 0 if
vmin == vmax.- __call__(value, clip=None)[source]
Normalize value data in the
[vmin, vmax]interval into the[0.0, 1.0]interval and return it.- Parameters
- value
Data to normalize.
- clipbool
If
None, defaults toself.clip(which defaults toFalse).
Notes
If not already initialized,
self.vminandself.vmaxare initialized usingself.autoscale_None(value).