mpl_toolkits.mplot3d
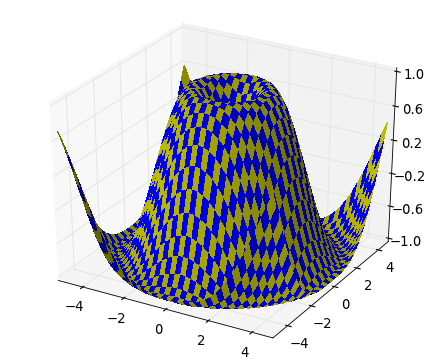
The mplot3d toolkit adds simple 3D plotting capabilities (scatter, surface, line, mesh, etc.) to Matplotlib by supplying an Axes object that can create a 2D projection of a 3D scene. The resulting graph will have the same look and feel as regular 2D plots. Not the fastest or most feature complete 3D library out there, but it ships with Matplotlib and thus may be a lighter weight solution for some use cases.
See the mplot3d tutorial for more information.
The interactive backends also provide the ability to rotate and zoom the 3D scene. One can rotate the 3D scene by simply clicking-and-dragging the scene. Zooming is done by right-clicking the scene and dragging the mouse up and down (unlike 2D plots, the toolbar zoom button is not used).
Note
pyplot cannot be used to add content to 3D plots, because its function
signatures are strictly 2D and cannot handle the additional information
needed for 3D. Instead, use the explicit API by calling the respective
methods on the Axes3D object.
axes3d
Note
3D plotting in Matplotlib is still not as mature as the 2D case. Please report any functions that do not behave as expected as a bug. In addition, help and patches would be greatly appreciated!
|
3D axes object. |
axis3d
Note
See mpl_toolkits.mplot3d.axis3d._axinfo for a dictionary containing
constants that may be modified for controlling the look and feel
of mplot3d axes (e.g., label spacing, font colors and panel colors).
Historically, axis3d has suffered from having hard-coded constants
that precluded user adjustments, and this dictionary was implemented
in version 1.1 as a stop-gap measure.
|
An Axis class for the 3D plots. |
art3d
|
3D line object. |
|
A collection of 3D lines. |
|
3D patch object. |
|
A collection of 3D patches. |
|
A collection of 3D paths. |
|
3D PathPatch object. |
|
A collection of 3D polygons. |
|
Text object with 3D position and direction. |
|
Return a direction vector. |
|
Reorder coordinates so that 2D xs, ys can be plotted in the plane orthogonal to zdir. |
|
Convert a 2D line to 3D. |
|
Convert a LineCollection to a Line3DCollection object. |
|
Convert a Patch to a Patch3D object. |
|
Convert a |
|
Convert a PathPatch to a PathPatch3D object. |
|
Convert a PolyCollection to a Poly3DCollection object. |
|
Reorder coordinates so that the axes are rotated with zdir along the original z axis. |
|
Convert a Text to a Text3D object. |
proj3d
|
|
|
|
|
|
|
|
|
Transform the points by the projection matrix |
|
Transform the points by the projection matrix and return the clipping result returns txs, tys, tzs, tis |
|
|
|
Transform the points by the projection matrix |
|
|
|
Produce a matrix that scales homogeneous coords in the specified ranges to [0, 1], or [0, pb_aspect[i]] if the plotbox aspect ratio is specified. |