Plot types
Overview of many common plotting commands in Matplotlib.
Note that we have stripped all labels, but they are present by default. See the gallery for many more examples and the tutorials page for longer examples.
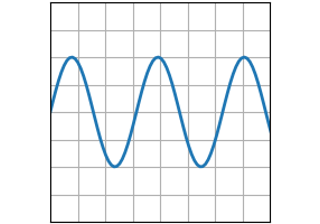
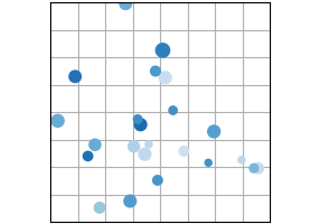
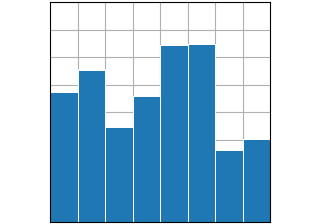
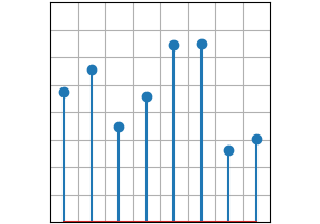
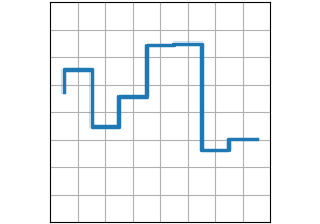
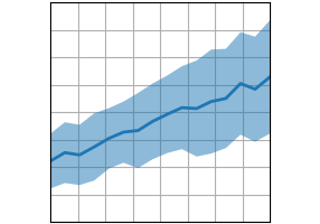
Basic
Basic plot types, usually y versus x.
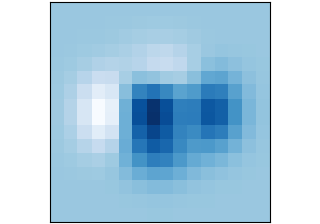
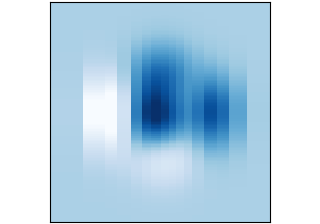
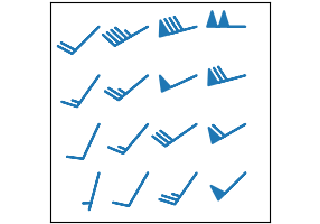
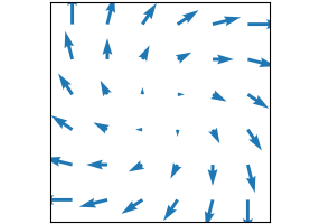
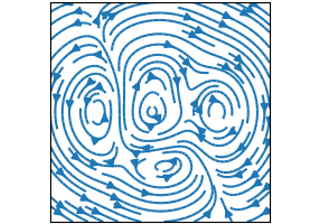
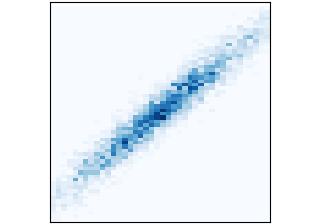
Plots of arrays and fields
Plotting for arrays of data Z(x, y) and fields U(x, y), V(x, y).


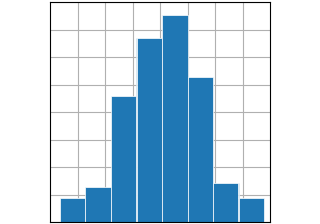
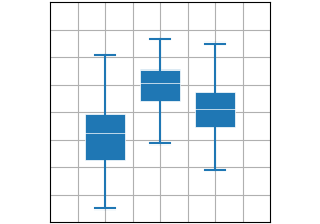
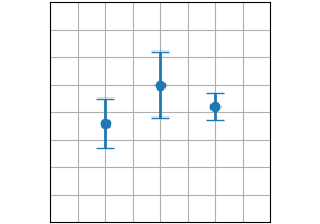
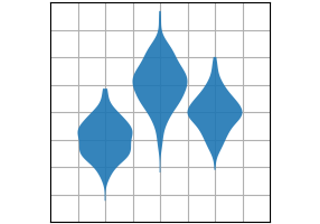
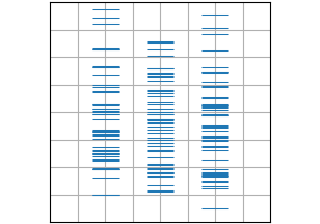
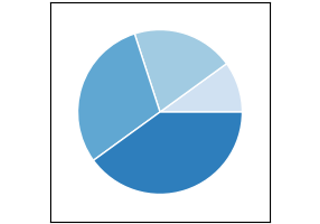
Statistics plots
Plots for statistical analysis.

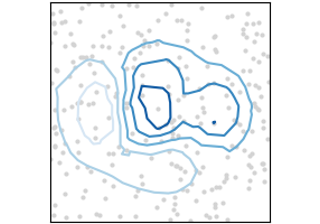
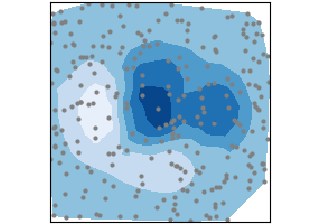
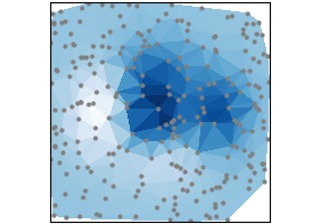
Unstructured coordinates
Sometimes we collect data z at coordinates (x,y) and want to visualize
as a contour. Instead of gridding the data and then using
contour, we can use a triangulation algorithm and fill the
triangles.

Keywords: matplotlib code example, codex, python plot, pyplot Gallery generated by Sphinx-Gallery