matplotlib.pyplot.stem
- matplotlib.pyplot.stem(*args, linefmt=None, markerfmt=None, basefmt=None, bottom=0, label=None, use_line_collection=True, orientation='vertical', data=None)[source]
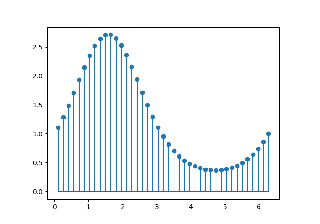
Create a stem plot.
A stem plot draws lines perpendicular to a baseline at each location locs from the baseline to heads, and places a marker there. For vertical stem plots (the default), the locs are x positions, and the heads are y values. For horizontal stem plots, the locs are y positions, and the heads are x values.
Call signature:
stem([locs,] heads, linefmt=None, markerfmt=None, basefmt=None)
The locs-positions are optional. The formats may be provided either as positional or as keyword-arguments.
- Parameters
- locsarray-like, default: (0, 1, ..., len(heads) - 1)
For vertical stem plots, the x-positions of the stems. For horizontal stem plots, the y-positions of the stems.
- headsarray-like
For vertical stem plots, the y-values of the stem heads. For horizontal stem plots, the x-values of the stem heads.
- linefmtstr, optional
A string defining the color and/or linestyle of the vertical lines:
Character
Line Style
'-'solid line
'--'dashed line
'-.'dash-dot line
':'dotted line
Default: 'C0-', i.e. solid line with the first color of the color cycle.
Note: Markers specified through this parameter (e.g. 'x') will be silently ignored (unless using
use_line_collection=False). Instead, markers should be specified using markerfmt.- markerfmtstr, optional
A string defining the color and/or shape of the markers at the stem heads. Default: 'C0o', i.e. filled circles with the first color of the color cycle.
- basefmtstr, default: 'C3-' ('C2-' in classic mode)
A format string defining the properties of the baseline.
- orientationstr, default: 'vertical'
If 'vertical', will produce a plot with stems oriented vertically, otherwise the stems will be oriented horizontally.
- bottomfloat, default: 0
The y/x-position of the baseline (depending on orientation).
- labelstr, default: None
The label to use for the stems in legends.
- use_line_collectionbool, default: True
If
True, store and plot the stem lines as aLineCollectioninstead of individual lines, which significantly increases performance. IfFalse, defaults to the old behavior of using a list ofLine2Dobjects. This parameter may be deprecated in the future.- dataindexable object, optional
If given, all parameters also accept a string
s, which is interpreted asdata[s](unless this raises an exception).
- Returns
StemContainerThe container may be treated like a tuple (markerline, stemlines, baseline)
Notes
See also
The MATLAB function stem which inspired this method.