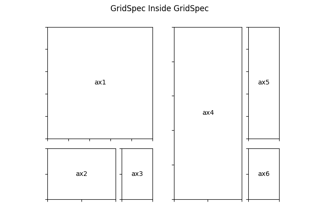
matplotlib.gridspec.GridSpec
- class matplotlib.gridspec.GridSpec(nrows, ncols, figure=None, left=None, bottom=None, right=None, top=None, wspace=None, hspace=None, width_ratios=None, height_ratios=None)[source]
Bases:
matplotlib.gridspec.GridSpecBaseA grid layout to place subplots within a figure.
The location of the grid cells is determined in a similar way to
SubplotParamsusing left, right, top, bottom, wspace and hspace.- Parameters
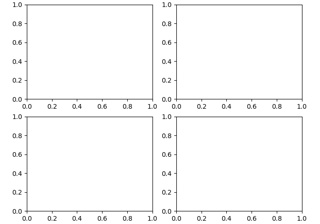
- nrows, ncolsint
The number of rows and columns of the grid.
- figure
Figure, optional Only used for constrained layout to create a proper layoutgrid.
- left, right, top, bottomfloat, optional
Extent of the subplots as a fraction of figure width or height. Left cannot be larger than right, and bottom cannot be larger than top. If not given, the values will be inferred from a figure or rcParams at draw time. See also
GridSpec.get_subplot_params.- wspacefloat, optional
The amount of width reserved for space between subplots, expressed as a fraction of the average axis width. If not given, the values will be inferred from a figure or rcParams when necessary. See also
GridSpec.get_subplot_params.- hspacefloat, optional
The amount of height reserved for space between subplots, expressed as a fraction of the average axis height. If not given, the values will be inferred from a figure or rcParams when necessary. See also
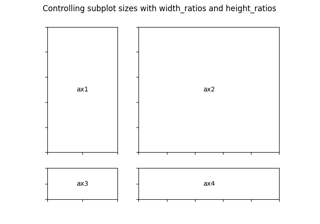
GridSpec.get_subplot_params.- width_ratiosarray-like of length ncols, optional
Defines the relative widths of the columns. Each column gets a relative width of
width_ratios[i] / sum(width_ratios). If not given, all columns will have the same width.- height_ratiosarray-like of length nrows, optional
Defines the relative heights of the rows. Each column gets a relative height of
height_ratios[i] / sum(height_ratios). If not given, all rows will have the same height.
- get_subplot_params(figure=None)[source]
Return the
SubplotParamsfor the GridSpec.In order of precedence the values are taken from
non-None attributes of the GridSpec
the provided figure
- locally_modified_subplot_params()[source]
Return a list of the names of the subplot parameters explicitly set in the GridSpec.
This is a subset of the attributes of
SubplotParams.
- tight_layout(figure, renderer=None, pad=1.08, h_pad=None, w_pad=None, rect=None)[source]
Adjust subplot parameters to give specified padding.
- Parameters
- padfloat
Padding between the figure edge and the edges of subplots, as a fraction of the font-size.
- h_pad, w_padfloat, optional
Padding (height/width) between edges of adjacent subplots. Defaults to pad.
- recttuple of 4 floats, default: (0, 0, 1, 1), i.e. the whole figure
(left, bottom, right, top) rectangle in normalized figure coordinates that the whole subplots area (including labels) will fit into.
- update(**kwargs)[source]
Update the subplot parameters of the grid.
Parameters that are not explicitly given are not changed. Setting a parameter to None resets it to
rcParams["figure.subplot.*"].- Parameters
- left, right, top, bottomfloat or None, optional
Extent of the subplots as a fraction of figure width or height.
- wspace, hspacefloat, optional
Spacing between the subplots as a fraction of the average subplot width / height.