matplotlib.colors.BoundaryNorm
- class matplotlib.colors.BoundaryNorm(boundaries, ncolors, clip=False, *, extend='neither')[source]
Bases:
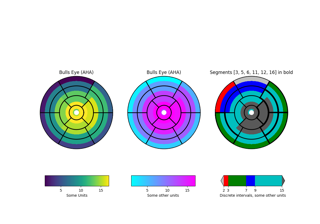
matplotlib.colors.NormalizeGenerate a colormap index based on discrete intervals.
Unlike
NormalizeorLogNorm,BoundaryNormmaps values to integers instead of to the interval 0-1.Mapping to the 0-1 interval could have been done via piece-wise linear interpolation, but using integers seems simpler, and reduces the number of conversions back and forth between integer and floating point.
- Parameters
- boundariesarray-like
Monotonically increasing sequence of at least 2 boundaries.
- ncolorsint
Number of colors in the colormap to be used.
- clipbool, optional
If clip is
True, out of range values are mapped to 0 if they are belowboundaries[0]or mapped toncolors - 1if they are aboveboundaries[-1].If clip is
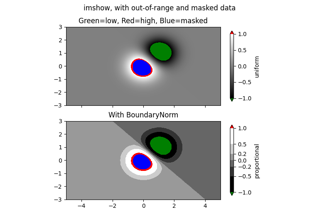
False, out of range values are mapped to -1 if they are belowboundaries[0]or mapped to ncolors if they are aboveboundaries[-1]. These are then converted to valid indices byColormap.__call__.- extend{'neither', 'both', 'min', 'max'}, default: 'neither'
Extend the number of bins to include one or both of the regions beyond the boundaries. For example, if
extendis 'min', then the color to which the region between the first pair of boundaries is mapped will be distinct from the first color in the colormap, and by default aColorbarwill be drawn with the triangle extension on the left or lower end.
- Returns
- int16 scalar or array
Notes
boundaries defines the edges of bins, and data falling within a bin is mapped to the color with the same index.
If the number of bins, including any extensions, is less than ncolors, the color index is chosen by linear interpolation, mapping the
[0, nbins - 1]range onto the[0, ncolors - 1]range.- __call__(value, clip=None)[source]
Normalize value data in the
[vmin, vmax]interval into the[0.0, 1.0]interval and return it.- Parameters
- value
Data to normalize.
- clipbool
If
None, defaults toself.clip(which defaults toFalse).
Notes
If not already initialized,
self.vminandself.vmaxare initialized usingself.autoscale_None(value).