matplotlib.ticker
Tick locating and formatting
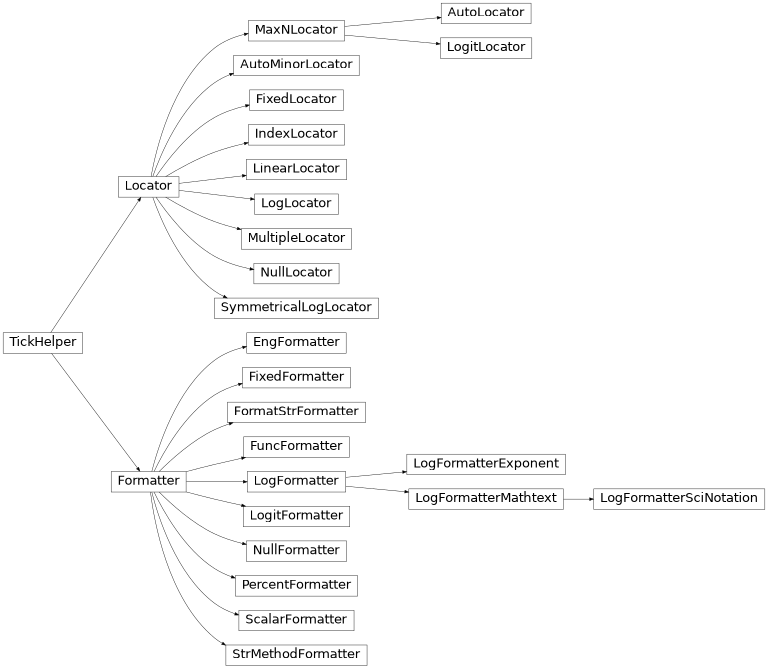
This module contains classes for configuring tick locating and formatting. Generic tick locators and formatters are provided, as well as domain specific custom ones.
Although the locators know nothing about major or minor ticks, they are used by the Axis class to support major and minor tick locating and formatting.
Tick locating
The Locator class is the base class for all tick locators. The locators
handle autoscaling of the view limits based on the data limits, and the
choosing of tick locations. A useful semi-automatic tick locator is
MultipleLocator. It is initialized with a base, e.g., 10, and it picks
axis limits and ticks that are multiples of that base.
The Locator subclasses defined here are:
|
|
Finds up to a max number of intervals with ticks at nice locations. |
|
Space ticks evenly from min to max. |
|
Space ticks logarithmically from min to max. |
|
Ticks and range are a multiple of base; either integer or float. |
|
Tick locations are fixed. |
|
Locator for index plots (e.g., where
|
|
No ticks. |
|
Locator for use with with the symlog norm; works like
|
|
Locator for logit scaling. |
|
Locator for minor ticks when the axis is linear and the major ticks are uniformly spaced. Subdivides the major tick interval into a specified number of minor intervals, defaulting to 4 or 5 depending on the major interval. |
There are a number of locators specialized for date locations - see
the dates module.
You can define your own locator by deriving from Locator. You must
override the __call__ method, which returns a sequence of locations,
and you will probably want to override the autoscale method to set the
view limits from the data limits.
If you want to override the default locator, use one of the above or a custom locator and pass it to the x or y axis instance. The relevant methods are:
ax.xaxis.set_major_locator(xmajor_locator)
ax.xaxis.set_minor_locator(xminor_locator)
ax.yaxis.set_major_locator(ymajor_locator)
ax.yaxis.set_minor_locator(yminor_locator)
The default minor locator is NullLocator, i.e., no minor ticks on by default.
Note
Locator instances should not be used with more than one
Axis or Axes. So instead of:
locator = MultipleLocator(5)
ax.xaxis.set_major_locator(locator)
ax2.xaxis.set_major_locator(locator)
do the following instead:
ax.xaxis.set_major_locator(MultipleLocator(5))
ax2.xaxis.set_major_locator(MultipleLocator(5))
Tick formatting
Tick formatting is controlled by classes derived from Formatter. The formatter operates on a single tick value and returns a string to the axis.
No labels on the ticks. |
|
Set the strings manually for the labels. |
|
User defined function sets the labels. |
|
Use string |
|
Use an old-style sprintf format string. |
|
Default formatter for scalars: autopick the format string. |
|
Formatter for log axes. |
|
Format values for log axis using
|
|
Format values for log axis using
|
|
Format values for log axis using scientific notation. |
|
Probability formatter. |
|
Format labels in engineering notation. |
|
Format labels as a percentage. |
You can derive your own formatter from the Formatter base class by
simply overriding the __call__ method. The formatter class has
access to the axis view and data limits.
To control the major and minor tick label formats, use one of the following methods:
ax.xaxis.set_major_formatter(xmajor_formatter)
ax.xaxis.set_minor_formatter(xminor_formatter)
ax.yaxis.set_major_formatter(ymajor_formatter)
ax.yaxis.set_minor_formatter(yminor_formatter)
In addition to a Formatter instance, set_major_formatter and
set_minor_formatter also accept a str or function. str input
will be internally replaced with an autogenerated StrMethodFormatter with
the input str. For function input, a FuncFormatter with the input
function will be generated and used.
See Major and minor ticks for an example of setting major
and minor ticks. See the matplotlib.dates module for more information
and examples of using date locators and formatters.
- class matplotlib.ticker.AutoLocator[source]
Bases:
matplotlib.ticker.MaxNLocatorDynamically find major tick positions. This is actually a subclass of
MaxNLocator, with parameters nbins = 'auto' and steps = [1, 2, 2.5, 5, 10].To know the values of the non-public parameters, please have a look to the defaults of
MaxNLocator.
- class matplotlib.ticker.AutoMinorLocator(n=None)[source]
Bases:
matplotlib.ticker.LocatorDynamically find minor tick positions based on the positions of major ticks. The scale must be linear with major ticks evenly spaced.
n is the number of subdivisions of the interval between major ticks; e.g., n=2 will place a single minor tick midway between major ticks.
If n is omitted or None, it will be set to 5 or 4.
- class matplotlib.ticker.EngFormatter(unit='', places=None, sep=' ', *, usetex=None, useMathText=None)[source]
Bases:
matplotlib.ticker.FormatterFormat axis values using engineering prefixes to represent powers of 1000, plus a specified unit, e.g., 10 MHz instead of 1e7.
- Parameters
- unitstr, default: ""
Unit symbol to use, suitable for use with single-letter representations of powers of 1000. For example, 'Hz' or 'm'.
- placesint, default: None
Precision with which to display the number, specified in digits after the decimal point (there will be between one and three digits before the decimal point). If it is None, the formatting falls back to the floating point format '%g', which displays up to 6 significant digits, i.e. the equivalent value for places varies between 0 and 5 (inclusive).
- sepstr, default: " "
Separator used between the value and the prefix/unit. For example, one get '3.14 mV' if
sepis " " (default) and '3.14mV' ifsepis "". Besides the default behavior, some other useful options may be:sep=""to append directly the prefix/unit to the value;sep="\N{THIN SPACE}"(U+2009);sep="\N{NARROW NO-BREAK SPACE}"(U+202F);sep="\N{NO-BREAK SPACE}"(U+00A0).
- usetexbool, default:
rcParams["text.usetex"](default:False) To enable/disable the use of TeX's math mode for rendering the numbers in the formatter.
- useMathTextbool, default:
rcParams["axes.formatter.use_mathtext"](default:False) To enable/disable the use mathtext for rendering the numbers in the formatter.
- ENG_PREFIXES = {-24: 'y', -21: 'z', -18: 'a', -15: 'f', -12: 'p', -9: 'n', -6: 'µ', -3: 'm', 0: '', 3: 'k', 6: 'M', 9: 'G', 12: 'T', 15: 'P', 18: 'E', 21: 'Z', 24: 'Y'}
- format_eng(num)[source]
Format a number in engineering notation, appending a letter representing the power of 1000 of the original number. Some examples:
>>> format_eng(0)       # for self.places = 0
'0'
>>> format_eng(1000000) # for self.places = 1
'1.0 M'
>>> format_eng("-1e-6") # for self.places = 2
'-1.00 µ'
- property useMathText
- property usetex
- class matplotlib.ticker.FixedFormatter(seq)[source]
Bases:
matplotlib.ticker.FormatterReturn fixed strings for tick labels based only on position, not value.
Note
FixedFormattershould only be used together withFixedLocator. Otherwise, the labels may end up in unexpected positions.Set the sequence seq of strings that will be used for labels.
- class matplotlib.ticker.FixedLocator(locs, nbins=None)[source]
Bases:
matplotlib.ticker.LocatorTick locations are fixed. If nbins is not None, the array of possible positions will be subsampled to keep the number of ticks <= nbins +1. The subsampling will be done so as to include the smallest absolute value; for example, if zero is included in the array of possibilities, then it is guaranteed to be one of the chosen ticks.
- class matplotlib.ticker.FormatStrFormatter(fmt)[source]
Bases:
matplotlib.ticker.FormatterUse an old-style ('%' operator) format string to format the tick.
The format string should have a single variable format (%) in it. It will be applied to the value (not the position) of the tick.
Negative numeric values will use a dash not a unicode minus, use mathtext to get a unicode minus by wrappping the format specifier with $ (e.g. "$%g$").
- class matplotlib.ticker.Formatter[source]
Bases:
matplotlib.ticker.TickHelperCreate a string based on a tick value and location.
- static fix_minus(s)[source]
Some classes may want to replace a hyphen for minus with the proper unicode symbol (U+2212) for typographical correctness. This is a helper method to perform such a replacement when it is enabled via
rcParams["axes.unicode_minus"](default:True).
- format_data(value)[source]
Return the full string representation of the value with the position unspecified.
- format_data_short(value)[source]
Return a short string version of the tick value.
Defaults to the position-independent long value.
- locs = []
- class matplotlib.ticker.FuncFormatter(func)[source]
Bases:
matplotlib.ticker.FormatterUse a user-defined function for formatting.
The function should take in two inputs (a tick value
xand a positionpos), and return a string containing the corresponding tick label.
- class matplotlib.ticker.IndexLocator(base, offset)[source]
Bases:
matplotlib.ticker.LocatorPlace a tick on every multiple of some base number of points plotted, e.g., on every 5th point. It is assumed that you are doing index plotting; i.e., the axis is 0, len(data). This is mainly useful for x ticks.
Place ticks every base data point, starting at offset.
- class matplotlib.ticker.LinearLocator(numticks=None, presets=None)[source]
Bases:
matplotlib.ticker.LocatorDetermine the tick locations
The first time this function is called it will try to set the number of ticks to make a nice tick partitioning. Thereafter the number of ticks will be fixed so that interactive navigation will be nice
Use presets to set locs based on lom. A dict mapping vmin, vmax->locs
- property numticks
- class matplotlib.ticker.Locator[source]
Bases:
matplotlib.ticker.TickHelperDetermine the tick locations;
Note that the same locator should not be used across multiple
Axisbecause the locator stores references to the Axis data and view limits.- MAXTICKS = 1000
- nonsingular(v0, v1)[source]
Adjust a range as needed to avoid singularities.
This method gets called during autoscaling, with
(v0, v1)set to the data limits on the axes if the axes contains any data, or(-inf, +inf)if not.If
v0 == v1(possibly up to some floating point slop), this method returns an expanded interval around this value.If
(v0, v1) == (-inf, +inf), this method returns appropriate default view limits.Otherwise,
(v0, v1)is returned without modification.
- raise_if_exceeds(locs)[source]
Log at WARNING level if locs is longer than
Locator.MAXTICKS.This is intended to be called immediately before returning locs from
__call__to inform users in case their Locator returns a huge number of ticks, causing Matplotlib to run out of memory.The "strange" name of this method dates back to when it would raise an exception instead of emitting a log.
- set_params(**kwargs)[source]
Do nothing, and raise a warning. Any locator class not supporting the set_params() function will call this.
- class matplotlib.ticker.LogFormatter(base=10.0, labelOnlyBase=False, minor_thresholds=None, linthresh=None)[source]
Bases:
matplotlib.ticker.FormatterBase class for formatting ticks on a log or symlog scale.
It may be instantiated directly, or subclassed.
- Parameters
- basefloat, default: 10.
Base of the logarithm used in all calculations.
- labelOnlyBasebool, default: False
If True, label ticks only at integer powers of base. This is normally True for major ticks and False for minor ticks.
- minor_thresholds(subset, all), default: (1, 0.4)
If labelOnlyBase is False, these two numbers control the labeling of ticks that are not at integer powers of base; normally these are the minor ticks. The controlling parameter is the log of the axis data range. In the typical case where base is 10 it is the number of decades spanned by the axis, so we can call it 'numdec'. If
numdec <= all, all minor ticks will be labeled. Ifall < numdec <= subset, then only a subset of minor ticks will be labeled, so as to avoid crowding. Ifnumdec > subsetthen no minor ticks will be labeled.- linthreshNone or float, default: None
If a symmetric log scale is in use, its
linthreshparameter must be supplied here.
Notes
The
set_locsmethod must be called to enable the subsetting logic controlled by theminor_thresholdsparameter.In some cases such as the colorbar, there is no distinction between major and minor ticks; the tick locations might be set manually, or by a locator that puts ticks at integer powers of base and at intermediate locations. For this situation, disable the minor_thresholds logic by using
minor_thresholds=(np.inf, np.inf), so that all ticks will be labeled.To disable labeling of minor ticks when 'labelOnlyBase' is False, use
minor_thresholds=(0, 0). This is the default for the "classic" style.Examples
To label a subset of minor ticks when the view limits span up to 2 decades, and all of the ticks when zoomed in to 0.5 decades or less, use
minor_thresholds=(2, 0.5).To label all minor ticks when the view limits span up to 1.5 decades, use
minor_thresholds=(1.5, 1.5).- base(base)[source]
Change the base for labeling.
Warning
Should always match the base used for
LogLocator
- format_data(value)[source]
Return the full string representation of the value with the position unspecified.
- format_data_short(value)[source]
Return a short string version of the tick value.
Defaults to the position-independent long value.
- class matplotlib.ticker.LogFormatterExponent(base=10.0, labelOnlyBase=False, minor_thresholds=None, linthresh=None)[source]
Bases:
matplotlib.ticker.LogFormatterFormat values for log axis using
exponent = log_base(value).
- class matplotlib.ticker.LogFormatterMathtext(base=10.0, labelOnlyBase=False, minor_thresholds=None, linthresh=None)[source]
Bases:
matplotlib.ticker.LogFormatterFormat values for log axis using
exponent = log_base(value).
- class matplotlib.ticker.LogFormatterSciNotation(base=10.0, labelOnlyBase=False, minor_thresholds=None, linthresh=None)[source]
Bases:
matplotlib.ticker.LogFormatterMathtextFormat values following scientific notation in a logarithmic axis.
- class matplotlib.ticker.LogLocator(base=10.0, subs=(1.0,), numdecs=4, numticks=None)[source]
Bases:
matplotlib.ticker.LocatorDetermine the tick locations for log axes
Place ticks on the locations : subs[j] * base**i
- Parameters
- basefloat, default: 10.0
The base of the log used, so ticks are placed at
base**n.- subsNone or str or sequence of float, default: (1.0,)
Gives the multiples of integer powers of the base at which to place ticks. The default places ticks only at integer powers of the base. The permitted string values are
'auto'and'all', both of which use an algorithm based on the axis view limits to determine whether and how to put ticks between integer powers of the base. With'auto', ticks are placed only between integer powers; with'all', the integer powers are included. A value of None is equivalent to'auto'.- numticksNone or int, default: None
The maximum number of ticks to allow on a given axis. The default of
Nonewill try to choose intelligently as long as this Locator has already been assigned to an axis usingget_tick_space, but otherwise falls back to 9.
- nonsingular(vmin, vmax)[source]
Adjust a range as needed to avoid singularities.
This method gets called during autoscaling, with
(v0, v1)set to the data limits on the axes if the axes contains any data, or(-inf, +inf)if not.If
v0 == v1(possibly up to some floating point slop), this method returns an expanded interval around this value.If
(v0, v1) == (-inf, +inf), this method returns appropriate default view limits.Otherwise,
(v0, v1)is returned without modification.
- set_params(base=None, subs=None, numdecs=None, numticks=None)[source]
Set parameters within this locator.
- class matplotlib.ticker.LogitFormatter(*, use_overline=False, one_half='\x0crac{1}{2}', minor=False, minor_threshold=25, minor_number=6)[source]
Bases:
matplotlib.ticker.FormatterProbability formatter (using Math text).
- Parameters
- use_overlinebool, default: False
If x > 1/2, with x = 1-v, indicate if x should be displayed as $overline{v}$. The default is to display $1-v$.
- one_halfstr, default: r"frac{1}{2}"
The string used to represent 1/2.
- minorbool, default: False
Indicate if the formatter is formatting minor ticks or not. Basically minor ticks are not labelled, except when only few ticks are provided, ticks with most space with neighbor ticks are labelled. See other parameters to change the default behavior.
- minor_thresholdint, default: 25
Maximum number of locs for labelling some minor ticks. This parameter have no effect if minor is False.
- minor_numberint, default: 6
Number of ticks which are labelled when the number of ticks is below the threshold.
- format_data_short(value)[source]
Return a short string version of the tick value.
Defaults to the position-independent long value.
- set_locs(locs)[source]
Set the locations of the ticks.
This method is called before computing the tick labels because some formatters need to know all tick locations to do so.
- set_minor_number(minor_number)[source]
Set the number of minor ticks to label when some minor ticks are labelled.
- Parameters
- minor_numberint
Number of ticks which are labelled when the number of ticks is below the threshold.
- set_minor_threshold(minor_threshold)[source]
Set the threshold for labelling minors ticks.
- Parameters
- minor_thresholdint
Maximum number of locations for labelling some minor ticks. This parameter have no effect if minor is False.
- class matplotlib.ticker.LogitLocator(minor=False, *, nbins='auto')[source]
Bases:
matplotlib.ticker.MaxNLocatorDetermine the tick locations for logit axes
Place ticks on the logit locations
- Parameters
- nbinsint or 'auto', optional
Number of ticks. Only used if minor is False.
- minorbool, default: False
Indicate if this locator is for minor ticks or not.
- property minor
- nonsingular(vmin, vmax)[source]
Adjust a range as needed to avoid singularities.
This method gets called during autoscaling, with
(v0, v1)set to the data limits on the axes if the axes contains any data, or(-inf, +inf)if not.If
v0 == v1(possibly up to some floating point slop), this method returns an expanded interval around this value.If
(v0, v1) == (-inf, +inf), this method returns appropriate default view limits.Otherwise,
(v0, v1)is returned without modification.
- class matplotlib.ticker.MaxNLocator(nbins=None, **kwargs)[source]
Bases:
matplotlib.ticker.LocatorFind nice tick locations with no more than N being within the view limits. Locations beyond the limits are added to support autoscaling.
- Parameters
- nbinsint or 'auto', default: 10
Maximum number of intervals; one less than max number of ticks. If the string 'auto', the number of bins will be automatically determined based on the length of the axis.
- stepsarray-like, optional
Sequence of nice numbers starting with 1 and ending with 10; e.g., [1, 2, 4, 5, 10], where the values are acceptable tick multiples. i.e. for the example, 20, 40, 60 would be an acceptable set of ticks, as would 0.4, 0.6, 0.8, because they are multiples of 2. However, 30, 60, 90 would not be allowed because 3 does not appear in the list of steps.
- integerbool, default: False
If True, ticks will take only integer values, provided at least min_n_ticks integers are found within the view limits.
- symmetricbool, default: False
If True, autoscaling will result in a range symmetric about zero.
- prune{'lower', 'upper', 'both', None}, default: None
Remove edge ticks -- useful for stacked or ganged plots where the upper tick of one axes overlaps with the lower tick of the axes above it, primarily when
rcParams["axes.autolimit_mode"](default:'data') is'round_numbers'. Ifprune=='lower', the smallest tick will be removed. Ifprune == 'upper', the largest tick will be removed. Ifprune == 'both', the largest and smallest ticks will be removed. If prune is None, no ticks will be removed.- min_n_ticksint, default: 2
Relax nbins and integer constraints if necessary to obtain this minimum number of ticks.
- default_params = {'integer': False, 'min_n_ticks': 2, 'nbins': 10, 'prune': None, 'steps': None, 'symmetric': False}
- set_params(**kwargs)[source]
Set parameters for this locator.
- Parameters
- nbinsint or 'auto', optional
see
MaxNLocator- stepsarray-like, optional
see
MaxNLocator- integerbool, optional
see
MaxNLocator- symmetricbool, optional
see
MaxNLocator- prune{'lower', 'upper', 'both', None}, optional
see
MaxNLocator- min_n_ticksint, optional
see
MaxNLocator
- class matplotlib.ticker.MultipleLocator(base=1.0)[source]
Bases:
matplotlib.ticker.LocatorSet a tick on each integer multiple of a base within the view interval.
- class matplotlib.ticker.NullFormatter[source]
Bases:
matplotlib.ticker.FormatterAlways return the empty string.
- class matplotlib.ticker.NullLocator[source]
Bases:
matplotlib.ticker.LocatorNo ticks
- class matplotlib.ticker.PercentFormatter(xmax=100, decimals=None, symbol='%', is_latex=False)[source]
Bases:
matplotlib.ticker.FormatterFormat numbers as a percentage.
- Parameters
- xmaxfloat
Determines how the number is converted into a percentage. xmax is the data value that corresponds to 100%. Percentages are computed as
x / xmax * 100. So if the data is already scaled to be percentages, xmax will be 100. Another common situation is where xmax is 1.0.- decimalsNone or int
The number of decimal places to place after the point. If None (the default), the number will be computed automatically.
- symbolstr or None
A string that will be appended to the label. It may be None or empty to indicate that no symbol should be used. LaTeX special characters are escaped in symbol whenever latex mode is enabled, unless is_latex is True.
- is_latexbool
If False, reserved LaTeX characters in symbol will be escaped.
- format_pct(x, display_range)[source]
Format the number as a percentage number with the correct number of decimals and adds the percent symbol, if any.
If
self.decimalsisNone, the number of digits after the decimal point is set based on the display_range of the axis as follows:display_range
decimals
sample
>50
0
x = 34.5=> 35%>5
1
x = 34.5=> 34.5%>0.5
2
x = 34.5=> 34.50%...
...
...
This method will not be very good for tiny axis ranges or extremely large ones. It assumes that the values on the chart are percentages displayed on a reasonable scale.
- property symbol
The configured percent symbol as a string.
If LaTeX is enabled via
rcParams["text.usetex"](default:False), the special characters{'#', '$', '%', '&', '~', '_', '^', '\', '{', '}'}are automatically escaped in the string.
- class matplotlib.ticker.ScalarFormatter(useOffset=None, useMathText=None, useLocale=None)[source]
Bases:
matplotlib.ticker.FormatterFormat tick values as a number.
- Parameters
- useOffsetbool or float, default:
rcParams["axes.formatter.useoffset"](default:True) Whether to use offset notation. See
set_useOffset.- useMathTextbool, default:
rcParams["axes.formatter.use_mathtext"](default:False) Whether to use fancy math formatting. See
set_useMathText.- useLocalebool, default:
rcParams["axes.formatter.use_locale"](default:False). Whether to use locale settings for decimal sign and positive sign. See
set_useLocale.
- useOffsetbool or float, default:
Notes
In addition to the parameters above, the formatting of scientific vs. floating point representation can be configured via
set_scientificandset_powerlimits).Offset notation and scientific notation
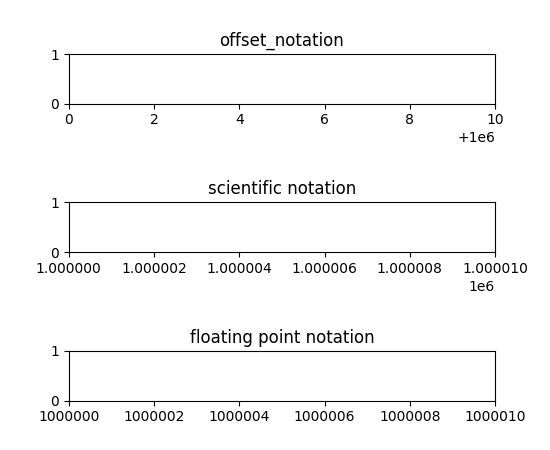
Offset notation and scientific notation look quite similar at first sight. Both split some information from the formatted tick values and display it at the end of the axis.
The scientific notation splits up the order of magnitude, i.e. a multiplicative scaling factor, e.g.
1e6.The offset notation separates an additive constant, e.g.
+1e6. The offset notation label is always prefixed with a+or-sign and is thus distinguishable from the order of magnitude label.
The following plot with x limits
1_000_000to1_000_010illustrates the different formatting. Note the labels at the right edge of the x axis.(Source code, png, pdf)
- format_data(value)[source]
Return the full string representation of the value with the position unspecified.
- format_data_short(value)[source]
Return a short string version of the tick value.
Defaults to the position-independent long value.
- get_useOffset()[source]
Return whether automatic mode for offset notation is active.
This returns True if
set_useOffset(True); it returns False if an explicit offset was set, e.g.set_useOffset(1000).See also
- set_locs(locs)[source]
Set the locations of the ticks.
This method is called before computing the tick labels because some formatters need to know all tick locations to do so.
- set_powerlimits(lims)[source]
Set size thresholds for scientific notation.
- Parameters
- lims(int, int)
A tuple (min_exp, max_exp) containing the powers of 10 that determine the switchover threshold. For a number representable as \(a \times 10^\mathrm{exp}\) with \(1 <= |a| < 10\), scientific notation will be used if
exp <= min_exporexp >= max_exp.The default limits are controlled by
rcParams["axes.formatter.limits"](default:[-5, 6]).In particular numbers with exp equal to the thresholds are written in scientific notation.
Typically, min_exp will be negative and max_exp will be positive.
For example,
formatter.set_powerlimits((-3, 4))will provide the following formatting: \(1 \times 10^{-3}, 9.9 \times 10^{-3}, 0.01,\) \(9999, 1 \times 10^4\).
See also
- set_useLocale(val)[source]
Set whether to use locale settings for decimal sign and positive sign.
- Parameters
- valbool or None
None resets to
rcParams["axes.formatter.use_locale"](default:False).
- set_useMathText(val)[source]
Set whether to use fancy math formatting.
If active, scientific notation is formatted as \(1.2 \times 10^3\).
- Parameters
- valbool or None
None resets to
rcParams["axes.formatter.use_mathtext"](default:False).
- set_useOffset(val)[source]
Set whether to use offset notation.
When formatting a set numbers whose value is large compared to their range, the formatter can separate an additive constant. This can shorten the formatted numbers so that they are less likely to overlap when drawn on an axis.
- Parameters
- valbool or float
If False, do not use offset notation.
If True (=automatic mode), use offset notation if it can make the residual numbers significantly shorter. The exact behavior is controlled by
rcParams["axes.formatter.offset_threshold"](default:4).If a number, force an offset of the given value.
Examples
With active offset notation, the values
100_000, 100_002, 100_004, 100_006, 100_008will be formatted as
0, 2, 4, 6, 8plus an offset+1e5, which is written to the edge of the axis.
- property useLocale
Return whether locale settings are used for formatting.
See also
- property useMathText
Return whether to use fancy math formatting.
See also
- property useOffset
Return whether automatic mode for offset notation is active.
This returns True if
set_useOffset(True); it returns False if an explicit offset was set, e.g.set_useOffset(1000).See also
- class matplotlib.ticker.StrMethodFormatter(fmt)[source]
Bases:
matplotlib.ticker.FormatterUse a new-style format string (as used by
str.format) to format the tick.The field used for the tick value must be labeled x and the field used for the tick position must be labeled pos.
- class matplotlib.ticker.SymmetricalLogLocator(transform=None, subs=None, linthresh=None, base=None)[source]
Bases:
matplotlib.ticker.LocatorDetermine the tick locations for symmetric log axes.
- Parameters
- transform
SymmetricalLogTransform, optional If set, defines the base and linthresh of the symlog transform.
- base, linthreshfloat, optional
The base and linthresh of the symlog transform, as documented for
SymmetricalLogScale. These parameters are only used if transform is not set.- subssequence of float, default: [1]
The multiples of integer powers of the base where ticks are placed, i.e., ticks are placed at
[sub * base**i for i in ... for sub in subs].
- transform
Notes
Either transform, or both base and linthresh, must be given.