matplotlib.axes.Axes.set_ylim
- Axes.set_ylim(bottom=None, top=None, emit=True, auto=False, *, ymin=None, ymax=None)[source]
Set the y-axis view limits.
- Parameters
- bottomfloat, optional
The bottom ylim in data coordinates. Passing None leaves the limit unchanged.
The bottom and top ylims may also be passed as the tuple (bottom, top) as the first positional argument (or as the bottom keyword argument).
- topfloat, optional
The top ylim in data coordinates. Passing None leaves the limit unchanged.
- emitbool, default: True
Whether to notify observers of limit change.
- autobool or None, default: False
Whether to turn on autoscaling of the y-axis. True turns on, False turns off, None leaves unchanged.
- ymin, ymaxfloat, optional
They are equivalent to bottom and top respectively, and it is an error to pass both ymin and bottom or ymax and top.
- Returns
- bottom, top(float, float)
The new y-axis limits in data coordinates.
See also
Notes
The bottom value may be greater than the top value, in which case the y-axis values will decrease from bottom to top.
Examples
>>> set_ylim(bottom, top)
>>> set_ylim((bottom, top))
>>> bottom, top = set_ylim(bottom, top)
One limit may be left unchanged.
>>> set_ylim(top=top_lim)
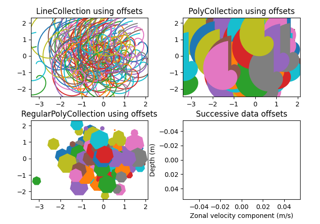
Limits may be passed in reverse order to flip the direction of the y-axis. For example, suppose
yrepresents depth of the ocean in m. The y-axis limits might be set like the following so 5000 m depth is at the bottom of the plot and the surface, 0 m, is at the top.>>> set_ylim(5000, 0)