Note
Click here to download the full example code
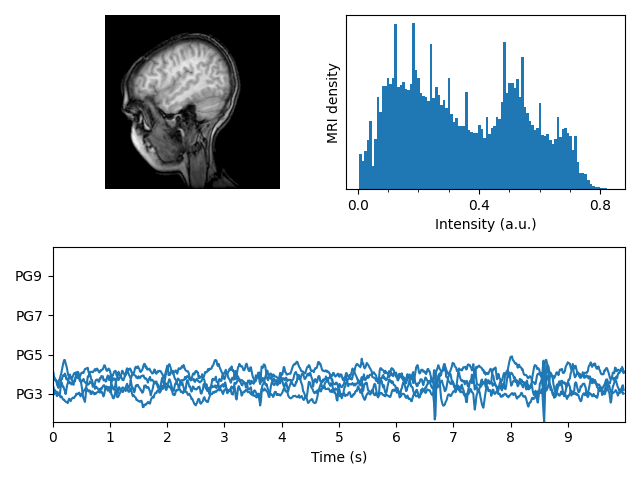
MRI With EEG
Displays a set of subplots with an MRI image, its intensity histogram and some EEG traces.
import numpy as np
import matplotlib.pyplot as plt
import matplotlib.cbook as cbook
import matplotlib.cm as cm

from matplotlib.collections import LineCollection
from matplotlib.ticker import MultipleLocator

fig = plt.figure("MRI_with_EEG")

# Load the MRI data (256x256 16 bit integers)
with cbook.get_sample_data('s1045.ima.gz') as dfile:
    im = np.frombuffer(dfile.read(), np.uint16).reshape((256, 256))

# Plot the MRI image
ax0 = fig.add_subplot(2, 2, 1)
ax0.imshow(im, cmap=cm.gray)
ax0.axis('off')

# Plot the histogram of MRI intensity
ax1 = fig.add_subplot(2, 2, 2)
im = np.ravel(im)
im = im[np.nonzero(im)]  # Ignore the background
im = im / (2**16 - 1)  # Normalize
ax1.hist(im, bins=100)
ax1.xaxis.set_major_locator(MultipleLocator(0.4))
ax1.minorticks_on()
ax1.set_yticks([])
ax1.set_xlabel('Intensity (a.u.)')
ax1.set_ylabel('MRI density')

# Load the EEG data
n_samples, n_rows = 800, 4
with cbook.get_sample_data('eeg.dat') as eegfile:
    data = np.fromfile(eegfile, dtype=float).reshape((n_samples, n_rows))
t = 10 * np.arange(n_samples) / n_samples

# Plot the EEG
ticklocs = []
ax2 = fig.add_subplot(2, 1, 2)
ax2.set_xlim(0, 10)
ax2.set_xticks(np.arange(10))
dmin = data.min()
dmax = data.max()
dr = (dmax - dmin) * 0.7  # Crowd them a bit.
y0 = dmin
y1 = (n_rows - 1) * dr + dmax
ax2.set_ylim(y0, y1)

segs = []
for i in range(n_rows):
    segs.append(np.column_stack((t, data[:, i])))
    ticklocs.append(i * dr)

offsets = np.zeros((n_rows, 2), dtype=float)
offsets[:, 1] = ticklocs

lines = LineCollection(segs, offsets=offsets, transOffset=None)
ax2.add_collection(lines)

# Set the yticks to use axes coordinates on the y axis
ax2.set_yticks(ticklocs, labels=['PG3', 'PG5', 'PG7', 'PG9'])

ax2.set_xlabel('Time (s)')


plt.tight_layout()
plt.show()
Keywords: matplotlib code example, codex, python plot, pyplot Gallery generated by Sphinx-Gallery