Note
Click here to download the full example code
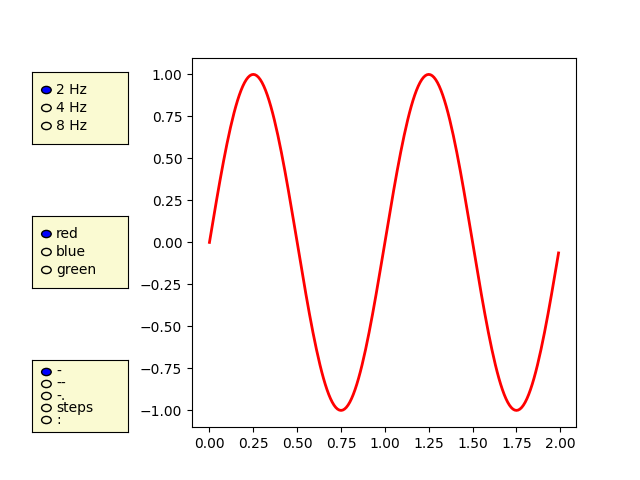
Radio Buttons
Using radio buttons to choose properties of your plot.
Radio buttons let you choose between multiple options in a visualization. In this case, the buttons let the user choose one of the three different sine waves to be shown in the plot.
import numpy as np
import matplotlib.pyplot as plt
from matplotlib.widgets import RadioButtons

t = np.arange(0.0, 2.0, 0.01)
s0 = np.sin(2*np.pi*t)
s1 = np.sin(4*np.pi*t)
s2 = np.sin(8*np.pi*t)

fig, ax = plt.subplots()
l, = ax.plot(t, s0, lw=2, color='red')
plt.subplots_adjust(left=0.3)

axcolor = 'lightgoldenrodyellow'
rax = plt.axes([0.05, 0.7, 0.15, 0.15], facecolor=axcolor)
radio = RadioButtons(rax, ('2 Hz', '4 Hz', '8 Hz'))


def hzfunc(label):
    hzdict = {'2 Hz': s0, '4 Hz': s1, '8 Hz': s2}
    ydata = hzdict[label]
    l.set_ydata(ydata)
    plt.draw()
radio.on_clicked(hzfunc)

rax = plt.axes([0.05, 0.4, 0.15, 0.15], facecolor=axcolor)
radio2 = RadioButtons(rax, ('red', 'blue', 'green'))


def colorfunc(label):
    l.set_color(label)
    plt.draw()
radio2.on_clicked(colorfunc)

rax = plt.axes([0.05, 0.1, 0.15, 0.15], facecolor=axcolor)
radio3 = RadioButtons(rax, ('-', '--', '-.', 'steps', ':'))


def stylefunc(label):
    l.set_linestyle(label)
    plt.draw()
radio3.on_clicked(stylefunc)

plt.show()
References
The use of the following functions, methods, classes and modules is shown in this example:
Keywords: matplotlib code example, codex, python plot, pyplot Gallery generated by Sphinx-Gallery