Note
Click here to download the full example code
The default tick formatter
The example shows use of the default ScalarFormatter with different
settings.
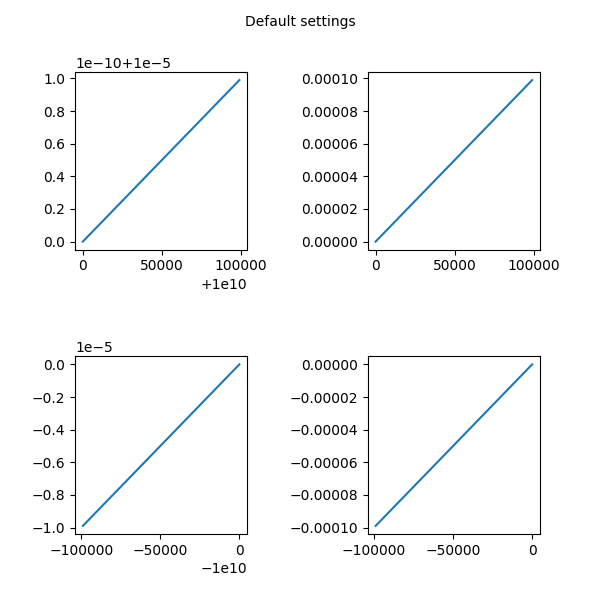
Example 1 : Default
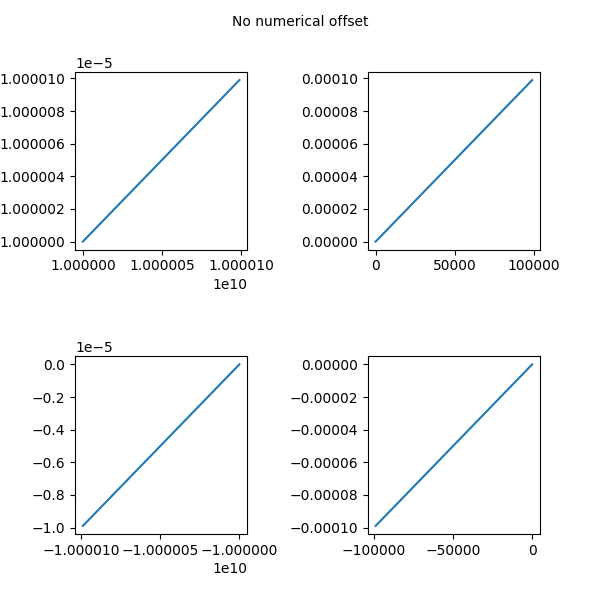
Example 2 : With no Numerical Offset
Example 3 : With Mathtext
import matplotlib.pyplot as plt
import numpy as np
Example 1
x = np.arange(0, 1, .01)
fig, [[ax1, ax2], [ax3, ax4]] = plt.subplots(2, 2, figsize=(6, 6))
fig.text(0.5, 0.975, 'Default settings',
         horizontalalignment='center',
         verticalalignment='top')

ax1.plot(x * 1e5 + 1e10, x * 1e-10 + 1e-5)

ax2.plot(x * 1e5, x * 1e-4)

ax3.plot(-x * 1e5 - 1e10, -x * 1e-5 - 1e-10)

ax4.plot(-x * 1e5, -x * 1e-4)

fig.subplots_adjust(wspace=0.7, hspace=0.6)
Example 2
x = np.arange(0, 1, .01)
fig, [[ax1, ax2], [ax3, ax4]] = plt.subplots(2, 2, figsize=(6, 6))
fig.text(0.5, 0.975, 'No numerical offset',
         horizontalalignment='center',
         verticalalignment='top')

ax1.plot(x * 1e5 + 1e10, x * 1e-10 + 1e-5)
ax1.ticklabel_format(useOffset=False)

ax2.plot(x * 1e5, x * 1e-4)
ax2.ticklabel_format(useOffset=False)

ax3.plot(-x * 1e5 - 1e10, -x * 1e-5 - 1e-10)
ax3.ticklabel_format(useOffset=False)

ax4.plot(-x * 1e5, -x * 1e-4)
ax4.ticklabel_format(useOffset=False)

fig.subplots_adjust(wspace=0.7, hspace=0.6)
Example 3
x = np.arange(0, 1, .01)
fig, [[ax1, ax2], [ax3, ax4]] = plt.subplots(2, 2, figsize=(6, 6))
fig.text(0.5, 0.975, 'With mathtext',
         horizontalalignment='center',
         verticalalignment='top')

ax1.plot(x * 1e5 + 1e10, x * 1e-10 + 1e-5)
ax1.ticklabel_format(useMathText=True)

ax2.plot(x * 1e5, x * 1e-4)
ax2.ticklabel_format(useMathText=True)

ax3.plot(-x * 1e5 - 1e10, -x * 1e-5 - 1e-10)
ax3.ticklabel_format(useMathText=True)

ax4.plot(-x * 1e5, -x * 1e-4)
ax4.ticklabel_format(useMathText=True)

fig.subplots_adjust(wspace=0.7, hspace=0.6)

plt.show()

Total running time of the script: ( 0 minutes 2.269 seconds)
Keywords: matplotlib code example, codex, python plot, pyplot Gallery generated by Sphinx-Gallery