Note
Click here to download the full example code
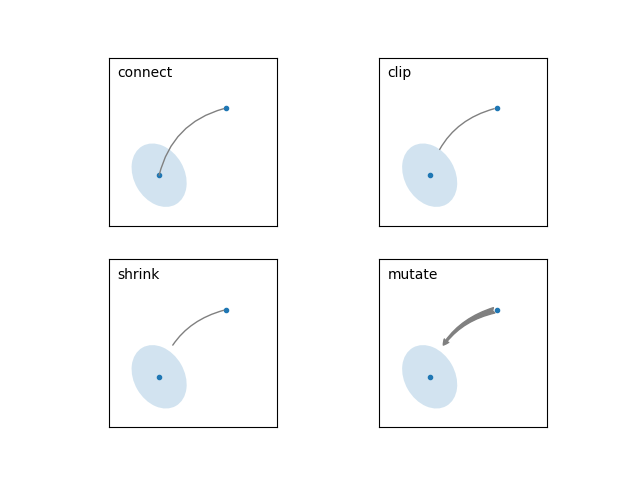
Annotate Explain
import matplotlib.pyplot as plt
import matplotlib.patches as mpatches


fig, axs = plt.subplots(2, 2)
x1, y1 = 0.3, 0.3
x2, y2 = 0.7, 0.7

ax = axs.flat[0]
ax.plot([x1, x2], [y1, y2], ".")
el = mpatches.Ellipse((x1, y1), 0.3, 0.4, angle=30, alpha=0.2)
ax.add_artist(el)
ax.annotate("",
            xy=(x1, y1), xycoords='data',
            xytext=(x2, y2), textcoords='data',
            arrowprops=dict(arrowstyle="-",
                            color="0.5",
                            patchB=None,
                            shrinkB=0,
                            connectionstyle="arc3,rad=0.3",
                            ),
            )
ax.text(.05, .95, "connect", transform=ax.transAxes, ha="left", va="top")

ax = axs.flat[1]
ax.plot([x1, x2], [y1, y2], ".")
el = mpatches.Ellipse((x1, y1), 0.3, 0.4, angle=30, alpha=0.2)
ax.add_artist(el)
ax.annotate("",
            xy=(x1, y1), xycoords='data',
            xytext=(x2, y2), textcoords='data',
            arrowprops=dict(arrowstyle="-",
                            color="0.5",
                            patchB=el,
                            shrinkB=0,
                            connectionstyle="arc3,rad=0.3",
                            ),
            )
ax.text(.05, .95, "clip", transform=ax.transAxes, ha="left", va="top")

ax = axs.flat[2]
ax.plot([x1, x2], [y1, y2], ".")
el = mpatches.Ellipse((x1, y1), 0.3, 0.4, angle=30, alpha=0.2)
ax.add_artist(el)
ax.annotate("",
            xy=(x1, y1), xycoords='data',
            xytext=(x2, y2), textcoords='data',
            arrowprops=dict(arrowstyle="-",
                            color="0.5",
                            patchB=el,
                            shrinkB=5,
                            connectionstyle="arc3,rad=0.3",
                            ),
            )
ax.text(.05, .95, "shrink", transform=ax.transAxes, ha="left", va="top")

ax = axs.flat[3]
ax.plot([x1, x2], [y1, y2], ".")
el = mpatches.Ellipse((x1, y1), 0.3, 0.4, angle=30, alpha=0.2)
ax.add_artist(el)
ax.annotate("",
            xy=(x1, y1), xycoords='data',
            xytext=(x2, y2), textcoords='data',
            arrowprops=dict(arrowstyle="fancy",
                            color="0.5",
                            patchB=el,
                            shrinkB=5,
                            connectionstyle="arc3,rad=0.3",
                            ),
            )
ax.text(.05, .95, "mutate", transform=ax.transAxes, ha="left", va="top")

for ax in axs.flat:
    ax.set(xlim=(0, 1), ylim=(0, 1), xticks=[], yticks=[], aspect=1)

plt.show()
Keywords: matplotlib code example, codex, python plot, pyplot Gallery generated by Sphinx-Gallery