Note
Click here to download the full example code
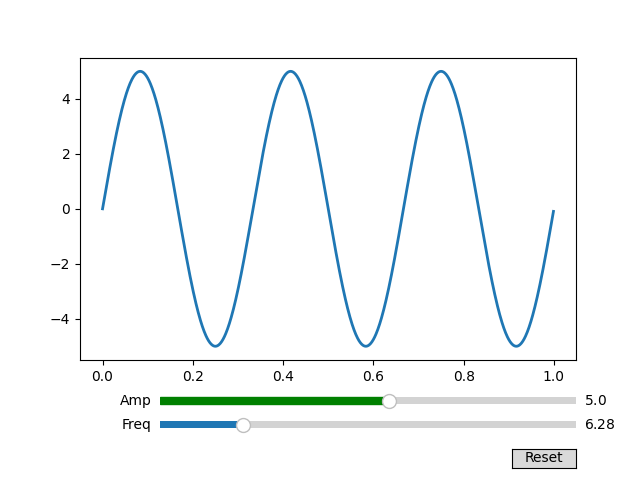
Snapping Sliders to Discrete Values
You can snap slider values to discrete values using the valstep argument.
In this example the Freq slider is constrained to be multiples of pi, and the
Amp slider uses an array as the valstep argument to more densely sample
the first part of its range.
See Slider for an example of using
a Slider to control a single float.
See Thresholding an Image with RangeSlider for an example of using
a RangeSlider to define a range of values.
import numpy as np
import matplotlib.pyplot as plt
from matplotlib.widgets import Slider, Button

t = np.arange(0.0, 1.0, 0.001)
a0 = 5
f0 = 3
s = a0 * np.sin(2 * np.pi * f0 * t)

fig, ax = plt.subplots()
plt.subplots_adjust(bottom=0.25)
l, = plt.plot(t, s, lw=2)

ax_freq = plt.axes([0.25, 0.1, 0.65, 0.03])
ax_amp = plt.axes([0.25, 0.15, 0.65, 0.03])

# define the values to use for snapping
allowed_amplitudes = np.concatenate([np.linspace(.1, 5, 100), [6, 7, 8, 9]])

# create the sliders
samp = Slider(
    ax_amp, "Amp", 0.1, 9.0,
    valinit=a0, valstep=allowed_amplitudes,
    color="green"
)

sfreq = Slider(
    ax_freq, "Freq", 0, 10*np.pi,
    valinit=2*np.pi, valstep=np.pi,
    initcolor='none'  # Remove the line marking the valinit position.
)


def update(val):
    amp = samp.val
    freq = sfreq.val
    l.set_ydata(amp*np.sin(2*np.pi*freq*t))
    fig.canvas.draw_idle()


sfreq.on_changed(update)
samp.on_changed(update)

ax_reset = plt.axes([0.8, 0.025, 0.1, 0.04])
button = Button(ax_reset, 'Reset', hovercolor='0.975')


def reset(event):
    sfreq.reset()
    samp.reset()
button.on_clicked(reset)


plt.show()
References
The use of the following functions, methods, classes and modules is shown in this example:
Keywords: matplotlib code example, codex, python plot, pyplot Gallery generated by Sphinx-Gallery