Note
Click here to download the full example code
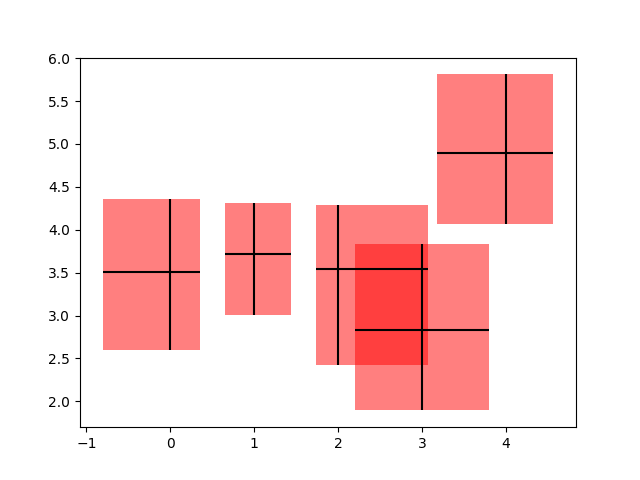
Creating boxes from error bars using PatchCollection
In this example, we snazz up a pretty standard error bar plot by adding
a rectangle patch defined by the limits of the bars in both the x- and
y- directions. To do this, we have to write our own custom function
called make_error_boxes. Close inspection of this function will
reveal the preferred pattern in writing functions for matplotlib:
an
Axesobject is passed directly to the functionthe function operates on the
Axesmethods directly, not through thepyplotinterfaceplotting keyword arguments that could be abbreviated are spelled out for better code readability in the future (for example we use facecolor instead of fc)
the artists returned by the
Axesplotting methods are then returned by the function so that, if desired, their styles can be modified later outside of the function (they are not modified in this example).
import numpy as np
import matplotlib.pyplot as plt
from matplotlib.collections import PatchCollection
from matplotlib.patches import Rectangle

# Number of data points
n = 5

# Dummy data
np.random.seed(19680801)
x = np.arange(0, n, 1)
y = np.random.rand(n) * 5.

# Dummy errors (above and below)
xerr = np.random.rand(2, n) + 0.1
yerr = np.random.rand(2, n) + 0.2


def make_error_boxes(ax, xdata, ydata, xerror, yerror, facecolor='r',
                     edgecolor='none', alpha=0.5):

    # Loop over data points; create box from errors at each point
    errorboxes = [Rectangle((x - xe[0], y - ye[0]), xe.sum(), ye.sum())
                  for x, y, xe, ye in zip(xdata, ydata, xerror.T, yerror.T)]

    # Create patch collection with specified colour/alpha
    pc = PatchCollection(errorboxes, facecolor=facecolor, alpha=alpha,
                         edgecolor=edgecolor)

    # Add collection to axes
    ax.add_collection(pc)

    # Plot errorbars
    artists = ax.errorbar(xdata, ydata, xerr=xerror, yerr=yerror,
                          fmt='none', ecolor='k')

    return artists


# Create figure and axes
fig, ax = plt.subplots(1)

# Call function to create error boxes
_ = make_error_boxes(ax, x, y, xerr, yerr)

plt.show()
References
The use of the following functions, methods, classes and modules is shown in this example:
Keywords: matplotlib code example, codex, python plot, pyplot Gallery generated by Sphinx-Gallery