Note
Click here to download the full example code
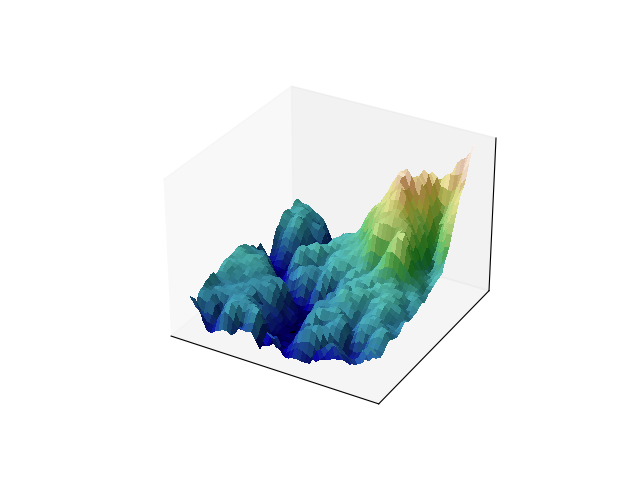
Frontpage 3D example
This example reproduces the frontpage 3D example.
from matplotlib import cbook
from matplotlib import cm
from matplotlib.colors import LightSource
import matplotlib.pyplot as plt
import numpy as np

dem = cbook.get_sample_data('jacksboro_fault_dem.npz', np_load=True)
z = dem['elevation']
nrows, ncols = z.shape
x = np.linspace(dem['xmin'], dem['xmax'], ncols)
y = np.linspace(dem['ymin'], dem['ymax'], nrows)
x, y = np.meshgrid(x, y)

region = np.s_[5:50, 5:50]
x, y, z = x[region], y[region], z[region]

fig, ax = plt.subplots(subplot_kw=dict(projection='3d'))

ls = LightSource(270, 45)
# To use a custom hillshading mode, override the built-in shading and pass
# in the rgb colors of the shaded surface calculated from "shade".
rgb = ls.shade(z, cmap=cm.gist_earth, vert_exag=0.1, blend_mode='soft')
surf = ax.plot_surface(x, y, z, rstride=1, cstride=1, facecolors=rgb,
                       linewidth=0, antialiased=False, shade=False)
ax.set_xticks([])
ax.set_yticks([])
ax.set_zticks([])
fig.savefig("surface3d_frontpage.png", dpi=25)  # results in 160x120 px image
Keywords: matplotlib code example, codex, python plot, pyplot Gallery generated by Sphinx-Gallery