Note
Click here to download the full example code
Zorder Demo
The drawing order of artists is determined by their zorder attribute, which
is a floating point number. Artists with higher zorder are drawn on top.
You can change the order for individual artists by setting their zorder.
The default value depends on the type of the Artist:
Artist |
Z-order |
|---|---|
Images ( |
0 |
1 |
|
|
2 |
Major ticks |
2.01 |
|
3 |
5 |
Any call to a plotting method can set a value for the zorder of that particular item explicitly.
Note
set_axisbelow and rcParams["axes.axisbelow"] (default: 'line') are convenient helpers
for setting the zorder of ticks and grid lines.
Drawing is done per Axes at a time. If you have overlapping Axes, all
elements of the second Axes are drawn on top of the first Axes, irrespective of
their relative zorder.
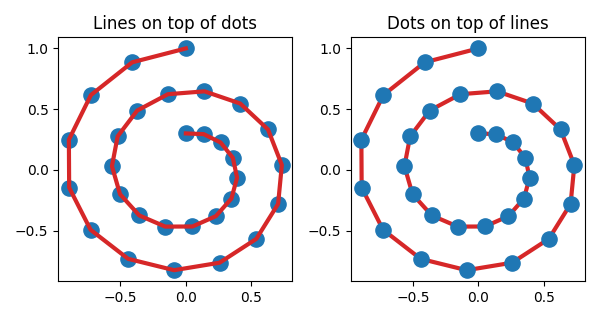
The following example contains a Line2D created by plot()
and the dots (a PatchCollection) created by scatter().
Hence, by default the dots are below the line (first subplot).
In the second subplot, the zorder is set explicitly to move the dots
on top of the line.
fig, (ax1, ax2) = plt.subplots(1, 2, figsize=(6, 3.2))

ax1.plot(x, y, 'C3', lw=3)
ax1.scatter(x, y, s=120)
ax1.set_title('Lines on top of dots')

ax2.plot(x, y, 'C3', lw=3)
ax2.scatter(x, y, s=120, zorder=2.5)  # move dots on top of line
ax2.set_title('Dots on top of lines')

plt.tight_layout()
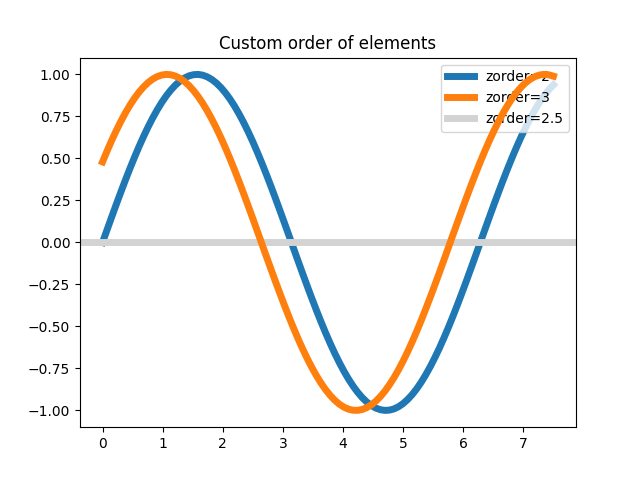
Many functions that create a visible object accepts a zorder parameter.
Alternatively, you can call set_order() on the created object later.
x = np.linspace(0, 7.5, 100)
plt.rcParams['lines.linewidth'] = 5
plt.figure()
plt.plot(x, np.sin(x), label='zorder=2', zorder=2)  # bottom
plt.plot(x, np.sin(x+0.5), label='zorder=3',  zorder=3)
plt.axhline(0, label='zorder=2.5', color='lightgrey', zorder=2.5)
plt.title('Custom order of elements')
l = plt.legend(loc='upper right')
l.set_zorder(2.5)  # legend between blue and orange line
plt.show()
Total running time of the script: ( 0 minutes 1.060 seconds)
Keywords: matplotlib code example, codex, python plot, pyplot Gallery generated by Sphinx-Gallery