Note
Click here to download the full example code
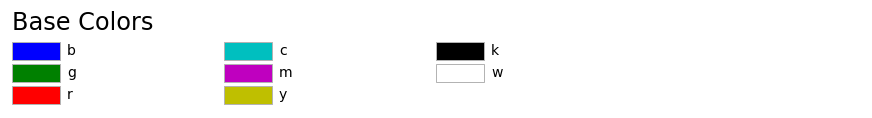
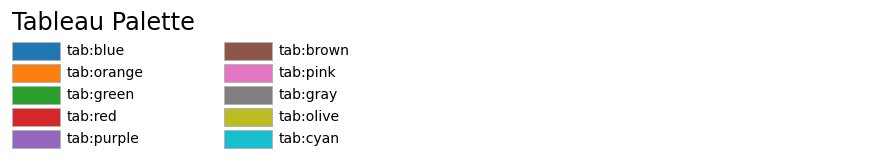
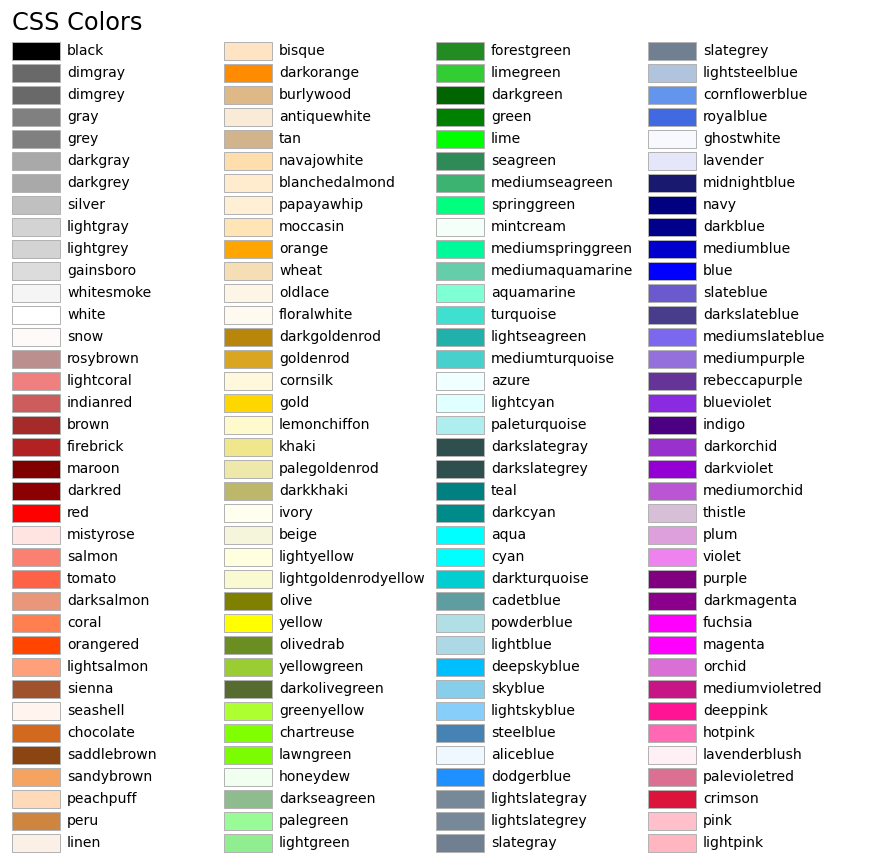
List of named colors
This plots a list of the named colors supported in matplotlib. Note that xkcd colors are supported as well, but are not listed here for brevity.
For more information on colors in matplotlib see
the Specifying Colors tutorial;
the
matplotlib.colorsAPI;the Color Demo.
from matplotlib.patches import Rectangle
import matplotlib.pyplot as plt
import matplotlib.colors as mcolors


def plot_colortable(colors, title, sort_colors=True, emptycols=0):

    cell_width = 212
    cell_height = 22
    swatch_width = 48
    margin = 12
    topmargin = 40

    # Sort colors by hue, saturation, value and name.
    if sort_colors is True:
        by_hsv = sorted((tuple(mcolors.rgb_to_hsv(mcolors.to_rgb(color))),
                         name)
                        for name, color in colors.items())
        names = [name for hsv, name in by_hsv]
    else:
        names = list(colors)

    n = len(names)
    ncols = 4 - emptycols
    nrows = n // ncols + int(n % ncols > 0)

    width = cell_width * 4 + 2 * margin
    height = cell_height * nrows + margin + topmargin
    dpi = 72

    fig, ax = plt.subplots(figsize=(width / dpi, height / dpi), dpi=dpi)
    fig.subplots_adjust(margin/width, margin/height,
                        (width-margin)/width, (height-topmargin)/height)
    ax.set_xlim(0, cell_width * 4)
    ax.set_ylim(cell_height * (nrows-0.5), -cell_height/2.)
    ax.yaxis.set_visible(False)
    ax.xaxis.set_visible(False)
    ax.set_axis_off()
    ax.set_title(title, fontsize=24, loc="left", pad=10)

    for i, name in enumerate(names):
        row = i % nrows
        col = i // nrows
        y = row * cell_height

        swatch_start_x = cell_width * col
        text_pos_x = cell_width * col + swatch_width + 7

        ax.text(text_pos_x, y, name, fontsize=14,
                horizontalalignment='left',
                verticalalignment='center')

        ax.add_patch(
            Rectangle(xy=(swatch_start_x, y-9), width=swatch_width,
                      height=18, facecolor=colors[name], edgecolor='0.7')
        )

    return fig

plot_colortable(mcolors.BASE_COLORS, "Base Colors",
                sort_colors=False, emptycols=1)
plot_colortable(mcolors.TABLEAU_COLORS, "Tableau Palette",
                sort_colors=False, emptycols=2)

plot_colortable(mcolors.CSS4_COLORS, "CSS Colors")

# Optionally plot the XKCD colors (Caution: will produce large figure)
# xkcd_fig = plot_colortable(mcolors.XKCD_COLORS, "XKCD Colors")
# xkcd_fig.savefig("XKCD_Colors.png")

plt.show()
References
The use of the following functions, methods, classes and modules is shown in this example:
Total running time of the script: ( 0 minutes 1.977 seconds)
Keywords: matplotlib code example, codex, python plot, pyplot Gallery generated by Sphinx-Gallery