Note
Click here to download the full example code
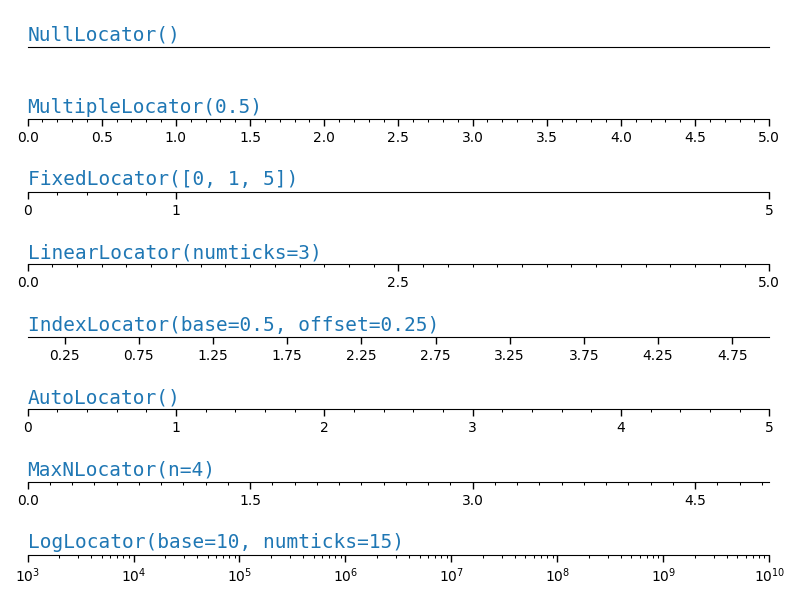
Tick locators
Tick locators define the position of the ticks.
This example illustrates the usage and effect of the most common locators.
import numpy as np
import matplotlib.pyplot as plt
import matplotlib.ticker as ticker


def setup(ax, title):
    """Set up common parameters for the Axes in the example."""
    # only show the bottom spine
    ax.yaxis.set_major_locator(ticker.NullLocator())
    ax.spines.right.set_color('none')
    ax.spines.left.set_color('none')
    ax.spines.top.set_color('none')

    ax.xaxis.set_ticks_position('bottom')
    ax.tick_params(which='major', width=1.00, length=5)
    ax.tick_params(which='minor', width=0.75, length=2.5)
    ax.set_xlim(0, 5)
    ax.set_ylim(0, 1)
    ax.text(0.0, 0.2, title, transform=ax.transAxes,
            fontsize=14, fontname='Monospace', color='tab:blue')


fig, axs = plt.subplots(8, 1, figsize=(8, 6))

# Null Locator
setup(axs[0], title="NullLocator()")
axs[0].xaxis.set_major_locator(ticker.NullLocator())
axs[0].xaxis.set_minor_locator(ticker.NullLocator())

# Multiple Locator
setup(axs[1], title="MultipleLocator(0.5)")
axs[1].xaxis.set_major_locator(ticker.MultipleLocator(0.5))
axs[1].xaxis.set_minor_locator(ticker.MultipleLocator(0.1))

# Fixed Locator
setup(axs[2], title="FixedLocator([0, 1, 5])")
axs[2].xaxis.set_major_locator(ticker.FixedLocator([0, 1, 5]))
axs[2].xaxis.set_minor_locator(ticker.FixedLocator(np.linspace(0.2, 0.8, 4)))

# Linear Locator
setup(axs[3], title="LinearLocator(numticks=3)")
axs[3].xaxis.set_major_locator(ticker.LinearLocator(3))
axs[3].xaxis.set_minor_locator(ticker.LinearLocator(31))

# Index Locator
setup(axs[4], title="IndexLocator(base=0.5, offset=0.25)")
axs[4].plot(range(0, 5), [0]*5, color='white')
axs[4].xaxis.set_major_locator(ticker.IndexLocator(base=0.5, offset=0.25))

# Auto Locator
setup(axs[5], title="AutoLocator()")
axs[5].xaxis.set_major_locator(ticker.AutoLocator())
axs[5].xaxis.set_minor_locator(ticker.AutoMinorLocator())

# MaxN Locator
setup(axs[6], title="MaxNLocator(n=4)")
axs[6].xaxis.set_major_locator(ticker.MaxNLocator(4))
axs[6].xaxis.set_minor_locator(ticker.MaxNLocator(40))

# Log Locator
setup(axs[7], title="LogLocator(base=10, numticks=15)")
axs[7].set_xlim(10**3, 10**10)
axs[7].set_xscale('log')
axs[7].xaxis.set_major_locator(ticker.LogLocator(base=10, numticks=15))

plt.tight_layout()
plt.show()
Total running time of the script: ( 0 minutes 1.272 seconds)
Keywords: matplotlib code example, codex, python plot, pyplot Gallery generated by Sphinx-Gallery