Note
Click here to download the full example code
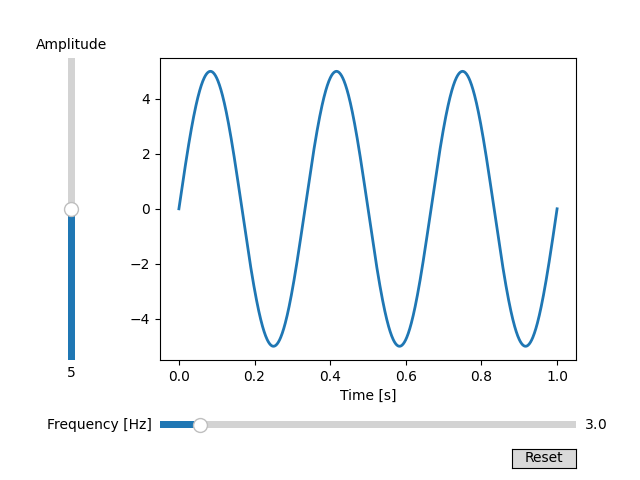
Slider
In this example, sliders are used to control the frequency and amplitude of a sine wave.
See Snapping Sliders to Discrete Values for an example of having
the Slider snap to discrete values.
See Thresholding an Image with RangeSlider for an example of using
a RangeSlider to define a range of values.
import numpy as np
import matplotlib.pyplot as plt
from matplotlib.widgets import Slider, Button


# The parametrized function to be plotted
def f(t, amplitude, frequency):
    return amplitude * np.sin(2 * np.pi * frequency * t)

t = np.linspace(0, 1, 1000)

# Define initial parameters
init_amplitude = 5
init_frequency = 3

# Create the figure and the line that we will manipulate
fig, ax = plt.subplots()
line, = plt.plot(t, f(t, init_amplitude, init_frequency), lw=2)
ax.set_xlabel('Time [s]')

# adjust the main plot to make room for the sliders
plt.subplots_adjust(left=0.25, bottom=0.25)

# Make a horizontal slider to control the frequency.
axfreq = plt.axes([0.25, 0.1, 0.65, 0.03])
freq_slider = Slider(
    ax=axfreq,
    label='Frequency [Hz]',
    valmin=0.1,
    valmax=30,
    valinit=init_frequency,
)

# Make a vertically oriented slider to control the amplitude
axamp = plt.axes([0.1, 0.25, 0.0225, 0.63])
amp_slider = Slider(
    ax=axamp,
    label="Amplitude",
    valmin=0,
    valmax=10,
    valinit=init_amplitude,
    orientation="vertical"
)


# The function to be called anytime a slider's value changes
def update(val):
    line.set_ydata(f(t, amp_slider.val, freq_slider.val))
    fig.canvas.draw_idle()


# register the update function with each slider
freq_slider.on_changed(update)
amp_slider.on_changed(update)

# Create a `matplotlib.widgets.Button` to reset the sliders to initial values.
resetax = plt.axes([0.8, 0.025, 0.1, 0.04])
button = Button(resetax, 'Reset', hovercolor='0.975')


def reset(event):
    freq_slider.reset()
    amp_slider.reset()
button.on_clicked(reset)

plt.show()
References
The use of the following functions, methods, classes and modules is shown in this example:
Keywords: matplotlib code example, codex, python plot, pyplot Gallery generated by Sphinx-Gallery