Note
Click here to download the full example code
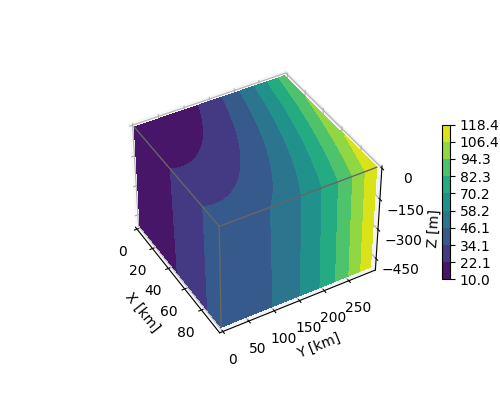
3D box surface plot
Given data on a gridded volume X, Y, Z, this example plots the
data values on the volume surfaces.
The strategy is to select the data from each surface and plot
contours separately using axes3d.Axes3D.contourf with appropriate
parameters zdir and offset.
import matplotlib.pyplot as plt
import numpy as np

# Define dimensions
Nx, Ny, Nz = 100, 300, 500
X, Y, Z = np.meshgrid(np.arange(Nx), np.arange(Ny), -np.arange(Nz))

# Create fake data
data = (((X+100)**2 + (Y-20)**2 + 2*Z)/1000+1)

kw = {
    'vmin': data.min(),
    'vmax': data.max(),
    'levels': np.linspace(data.min(), data.max(), 10),
}

# Create a figure with 3D ax
fig = plt.figure(figsize=(5, 4))
ax = fig.add_subplot(111, projection='3d')

# Plot contour surfaces
_ = ax.contourf(
    X[:, :, 0], Y[:, :, 0], data[:, :, 0],
    zdir='z', offset=0, **kw
)
_ = ax.contourf(
    X[0, :, :], data[0, :, :], Z[0, :, :],
    zdir='y', offset=0, **kw
)
C = ax.contourf(
    data[:, -1, :], Y[:, -1, :], Z[:, -1, :],
    zdir='x', offset=X.max(), **kw
)
# --


# Set limits of the plot from coord limits
xmin, xmax = X.min(), X.max()
ymin, ymax = Y.min(), Y.max()
zmin, zmax = Z.min(), Z.max()
ax.set(xlim=[xmin, xmax], ylim=[ymin, ymax], zlim=[zmin, zmax])

# Plot edges
edges_kw = dict(color='0.4', linewidth=1, zorder=1e3)
ax.plot([xmax, xmax], [ymin, ymax], 0, **edges_kw)
ax.plot([xmin, xmax], [ymin, ymin], 0, **edges_kw)
ax.plot([xmax, xmax], [ymin, ymin], [zmin, zmax], **edges_kw)

# Set labels and zticks
ax.set(
    xlabel='X [km]',
    ylabel='Y [km]',
    zlabel='Z [m]',
    zticks=[0, -150, -300, -450],
)

# Set distance and angle view
ax.view_init(40, -30)
ax.dist = 11

# Colorbar
fig.colorbar(C, ax=ax, fraction=0.02, pad=0.1, label='Name [units]')

# Show Figure
plt.show()
Keywords: matplotlib code example, codex, python plot, pyplot Gallery generated by Sphinx-Gallery