Note
Click here to download the full example code
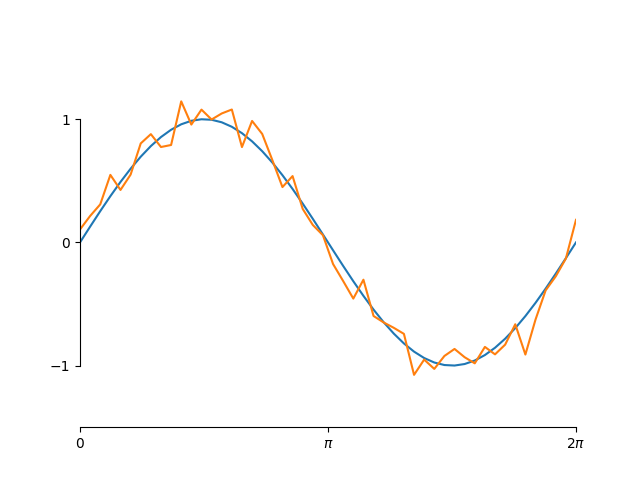
Custom spine bounds
Demo of spines using custom bounds to limit the extent of the spine.
import numpy as np
import matplotlib.pyplot as plt

# Fixing random state for reproducibility
np.random.seed(19680801)

x = np.linspace(0, 2*np.pi, 50)
y = np.sin(x)
y2 = y + 0.1 * np.random.normal(size=x.shape)

fig, ax = plt.subplots()
ax.plot(x, y)
ax.plot(x, y2)

# set ticks and tick labels
ax.set_xlim((0, 2*np.pi))
ax.set_xticks([0, np.pi, 2*np.pi], labels=['0', r'$\pi$', r'2$\pi$'])
ax.set_ylim((-1.5, 1.5))
ax.set_yticks([-1, 0, 1])

# Only draw spine between the y-ticks
ax.spines.left.set_bounds((-1, 1))
# Hide the right and top spines
ax.spines.right.set_visible(False)
ax.spines.top.set_visible(False)
# Only show ticks on the left and bottom spines
ax.yaxis.set_ticks_position('left')
ax.xaxis.set_ticks_position('bottom')

plt.show()
Keywords: matplotlib code example, codex, python plot, pyplot Gallery generated by Sphinx-Gallery