Note
Click here to download the full example code
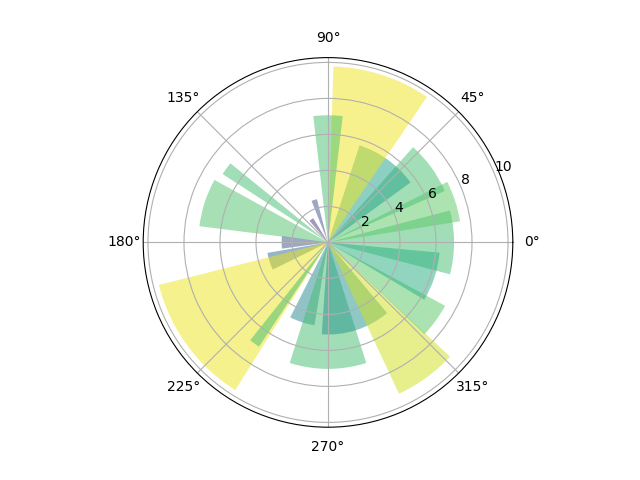
Bar chart on polar axis
Demo of bar plot on a polar axis.
import numpy as np
import matplotlib.pyplot as plt


# Fixing random state for reproducibility
np.random.seed(19680801)

# Compute pie slices
N = 20
theta = np.linspace(0.0, 2 * np.pi, N, endpoint=False)
radii = 10 * np.random.rand(N)
width = np.pi / 4 * np.random.rand(N)
colors = plt.cm.viridis(radii / 10.)

ax = plt.subplot(projection='polar')
ax.bar(theta, radii, width=width, bottom=0.0, color=colors, alpha=0.5)

plt.show()
References
The use of the following functions, methods, classes and modules is shown in this example:
Keywords: matplotlib code example, codex, python plot, pyplot Gallery generated by Sphinx-Gallery