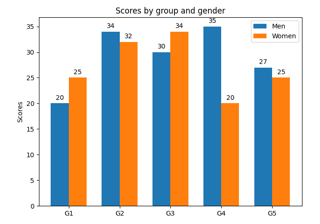
matplotlib.axes.Axes.bar
- Axes.bar(x, height, width=0.8, bottom=None, *, align='center', data=None, **kwargs)[source]
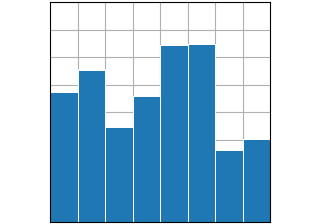
Make a bar plot.
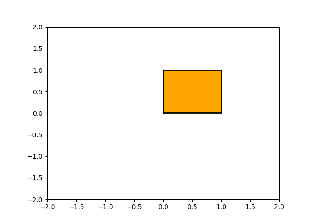
The bars are positioned at x with the given alignment. Their dimensions are given by height and width. The vertical baseline is bottom (default 0).
Many parameters can take either a single value applying to all bars or a sequence of values, one for each bar.
- Parameters
- xfloat or array-like
The x coordinates of the bars. See also align for the alignment of the bars to the coordinates.
- heightfloat or array-like
The height(s) of the bars.
- widthfloat or array-like, default: 0.8
The width(s) of the bars.
- bottomfloat or array-like, default: 0
The y coordinate(s) of the bars bases.
- align{'center', 'edge'}, default: 'center'
Alignment of the bars to the x coordinates:
'center': Center the base on the x positions.
'edge': Align the left edges of the bars with the x positions.
To align the bars on the right edge pass a negative width and
align='edge'.
- Returns
BarContainerContainer with all the bars and optionally errorbars.
- Other Parameters
- colorcolor or list of color, optional
The colors of the bar faces.
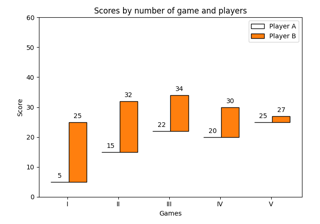
- edgecolorcolor or list of color, optional
The colors of the bar edges.
- linewidthfloat or array-like, optional
Width of the bar edge(s). If 0, don't draw edges.
- tick_labelstr or list of str, optional
The tick labels of the bars. Default: None (Use default numeric labels.)
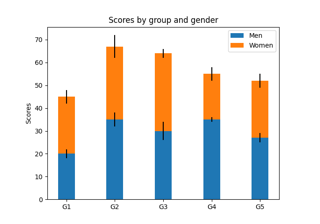
- xerr, yerrfloat or array-like of shape(N,) or shape(2, N), optional
If not None, add horizontal / vertical errorbars to the bar tips. The values are +/- sizes relative to the data:
scalar: symmetric +/- values for all bars
shape(N,): symmetric +/- values for each bar
shape(2, N): Separate - and + values for each bar. First row contains the lower errors, the second row contains the upper errors.
None: No errorbar. (Default)
See Different ways of specifying error bars for an example on the usage of
xerrandyerr.- ecolorcolor or list of color, default: 'black'
The line color of the errorbars.
- capsizefloat, default:
rcParams["errorbar.capsize"](default:0.0) The length of the error bar caps in points.
- error_kwdict, optional
Dictionary of kwargs to be passed to the
errorbarmethod. Values of ecolor or capsize defined here take precedence over the independent kwargs.- logbool, default: False
If True, set the y-axis to be log scale.
- dataindexable object, optional
If given, all parameters also accept a string
s, which is interpreted asdata[s](unless this raises an exception).- **kwargs
Rectangleproperties Property
Description
a filter function, which takes a (m, n, 3) float array and a dpi value, and returns a (m, n, 3) array
scalar or None
unknown
bool
antialiasedor aabool or None
(left, bottom, width, height)
CapStyleor {'butt', 'projecting', 'round'}bool
Patch or (Path, Transform) or None
color
edgecoloror eccolor or None
facecoloror fccolor or None
bool
str
{'/', '\', '|', '-', '+', 'x', 'o', 'O', '.', '*'}
unknown
bool
JoinStyleor {'miter', 'round', 'bevel'}object
linestyleor ls{'-', '--', '-.', ':', '', (offset, on-off-seq), ...}
linewidthor lwfloat or None
None or bool or float or callable
bool
(scale: float, length: float, randomness: float)
bool or None
str
bool
unknown
unknown
(float, float)
unknown
float
See also
barhPlot a horizontal bar plot.
Notes
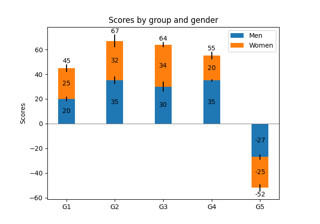
Stacked bars can be achieved by passing individual bottom values per bar. See Stacked bar chart.