mpl_toolkits.axes_grid1.inset_locator.mark_inset
- mpl_toolkits.axes_grid1.inset_locator.mark_inset(parent_axes, inset_axes, loc1, loc2, **kwargs)[source]
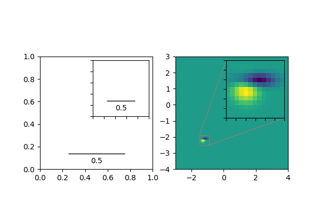
Draw a box to mark the location of an area represented by an inset axes.
This function draws a box in parent_axes at the bounding box of inset_axes, and shows a connection with the inset axes by drawing lines at the corners, giving a "zoomed in" effect.
- Parameters
- parent_axes
matplotlib.axes.Axes Axes which contains the area of the inset axes.
- inset_axes
matplotlib.axes.Axes The inset axes.
- loc1, loc2{1, 2, 3, 4}
Corners to use for connecting the inset axes and the area in the parent axes.
- **kwargs
Patch properties for the lines and box drawn:
Property
Description
a filter function, which takes a (m, n, 3) float array and a dpi value, and returns a (m, n, 3) array
unknown
bool
antialiasedor aabool or None
CapStyleor {'butt', 'projecting', 'round'}bool
Patch or (Path, Transform) or None
color
edgecoloror eccolor or None
facecoloror fccolor or None
bool
str
{'/', '\', '|', '-', '+', 'x', 'o', 'O', '.', '*'}
bool
JoinStyleor {'miter', 'round', 'bevel'}object
linestyleor ls{'-', '--', '-.', ':', '', (offset, on-off-seq), ...}
linewidthor lwfloat or None
None or bool or float or callable
bool
(scale: float, length: float, randomness: float)
bool or None
str
bool
float
- parent_axes
- Returns
- pp
matplotlib.patches.Patch The patch drawn to represent the area of the inset axes.
- p1, p2
matplotlib.patches.Patch The patches connecting two corners of the inset axes and its area.
- pp