matplotlib.pyplot.setp
- matplotlib.pyplot.setp(obj, *args, **kwargs)[source]
Set one or more properties on an
Artist, or list allowed values.- Parameters
- obj
Artistor list ofArtist The artist(s) whose properties are being set or queried. When setting properties, all artists are affected; when querying the allowed values, only the first instance in the sequence is queried.
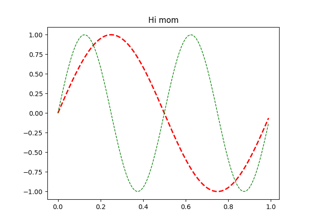
For example, two lines can be made thicker and red with a single call:
>>> x = arange(0, 1, 0.01)
>>> lines = plot(x, sin(2*pi*x), x, sin(4*pi*x))
>>> setp(lines, linewidth=2, color='r')
- filefile-like, default:
sys.stdout Where
setpwrites its output when asked to list allowed values.>>> with open('output.log') as file: ... setp(line, file=file)
The default,
None, meanssys.stdout.- *args, **kwargs
The properties to set. The following combinations are supported:
Set the linestyle of a line to be dashed:
>>> line, = plot([1, 2, 3])
>>> setp(line, linestyle='--')
Set multiple properties at once:
>>> setp(line, linewidth=2, color='r')
List allowed values for a line's linestyle:
>>> setp(line, 'linestyle')
linestyle: {'-', '--', '-.', ':', '', (offset, on-off-seq), ...}
List all properties that can be set, and their allowed values:
>>> setp(line)
agg_filter: a filter function, ...
[long output listing omitted]
setpalso supports MATLAB style string/value pairs. For example, the following are equivalent:>>> setp(lines, 'linewidth', 2, 'color', 'r') # MATLAB style >>> setp(lines, linewidth=2, color='r') # Python style
- obj
See also


