matplotlib.pyplot.subplots_adjust#
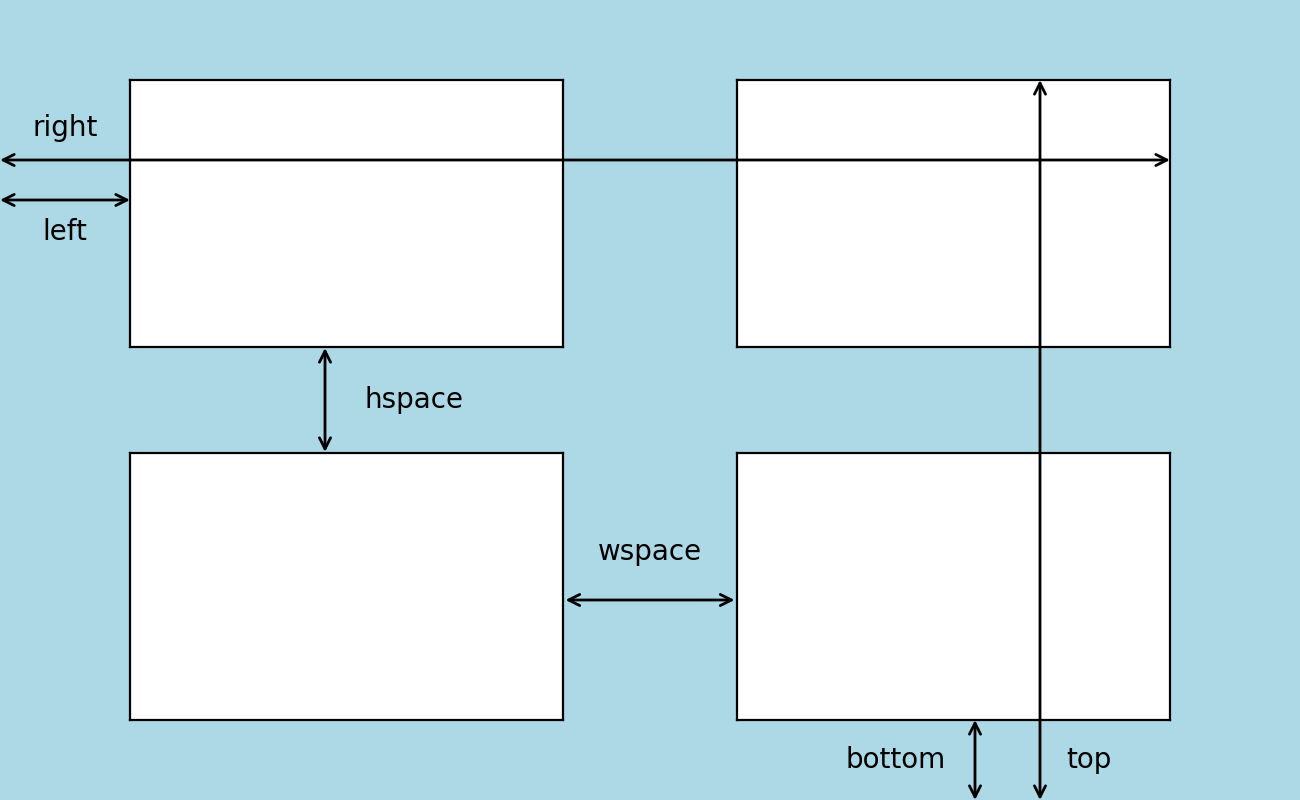
- matplotlib.pyplot.subplots_adjust(left=None, bottom=None, right=None, top=None, wspace=None, hspace=None)[source]#
Adjust the subplot layout parameters.
Unset parameters are left unmodified; initial values are given by
rcParams["figure.subplot.[name]"].(
Source code,2x.png,png)
- Parameters:
- leftfloat, optional
The position of the left edge of the subplots, as a fraction of the figure width.
- rightfloat, optional
The position of the right edge of the subplots, as a fraction of the figure width.
- bottomfloat, optional
The position of the bottom edge of the subplots, as a fraction of the figure height.
- topfloat, optional
The position of the top edge of the subplots, as a fraction of the figure height.
- wspacefloat, optional
The width of the padding between subplots, as a fraction of the average Axes width.
- hspacefloat, optional
The height of the padding between subplots, as a fraction of the average Axes height.
Notes
Note
This is the pyplot wrapper for
Figure.subplots_adjust.

Examples using matplotlib.pyplot.subplots_adjust#


Controlling style of text and labels using a dictionary

