Note
Click here to download the full example code
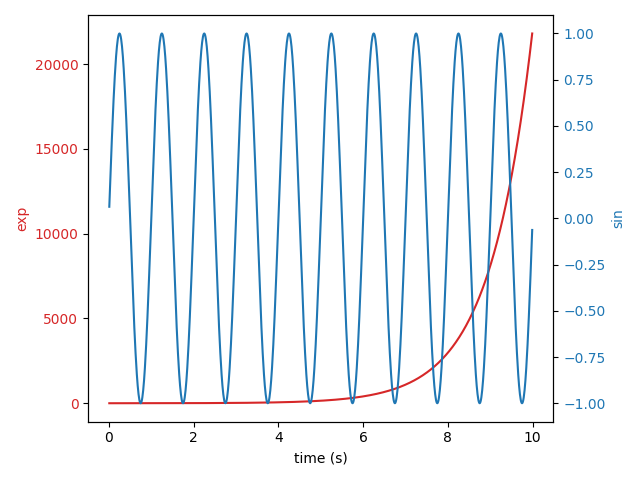
Plots with different scales#
Two plots on the same axes with different left and right scales.
The trick is to use two different axes that share the same x axis.
You can use separate matplotlib.ticker formatters and locators as
desired since the two axes are independent.
Such axes are generated by calling the Axes.twinx method. Likewise,
Axes.twiny is available to generate axes that share a y axis but
have different top and bottom scales.
import numpy as np
import matplotlib.pyplot as plt

# Create some mock data
t = np.arange(0.01, 10.0, 0.01)
data1 = np.exp(t)
data2 = np.sin(2 * np.pi * t)

fig, ax1 = plt.subplots()

color = 'tab:red'
ax1.set_xlabel('time (s)')
ax1.set_ylabel('exp', color=color)
ax1.plot(t, data1, color=color)
ax1.tick_params(axis='y', labelcolor=color)

ax2 = ax1.twinx()  # instantiate a second axes that shares the same x-axis

color = 'tab:blue'
ax2.set_ylabel('sin', color=color)  # we already handled the x-label with ax1
ax2.plot(t, data2, color=color)
ax2.tick_params(axis='y', labelcolor=color)

fig.tight_layout()  # otherwise the right y-label is slightly clipped
plt.show()
References
The use of the following functions, methods, classes and modules is shown in this example:
Keywords: matplotlib code example, codex, python plot, pyplot Gallery generated by Sphinx-Gallery