Note
Click here to download the full example code
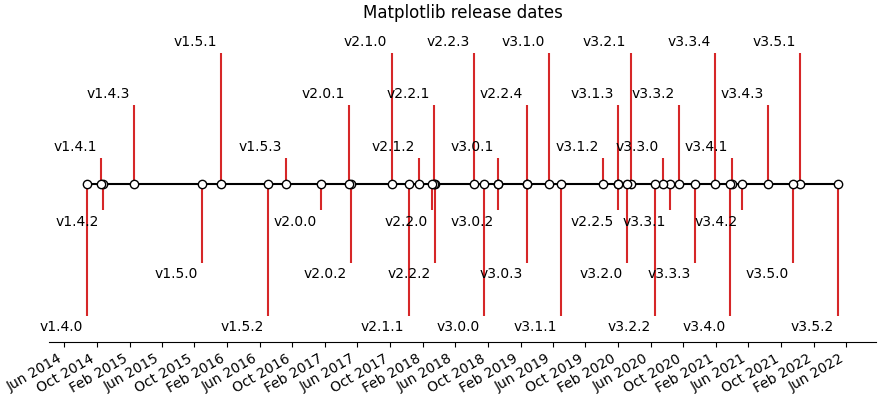
Creating a timeline with lines, dates, and text#
How to create a simple timeline using Matplotlib release dates.
Timelines can be created with a collection of dates and text. In this example, we show how to create a simple timeline using the dates for recent releases of Matplotlib. First, we'll pull the data from GitHub.
import matplotlib.pyplot as plt
import numpy as np
import matplotlib.dates as mdates
from datetime import datetime

try:
    # Try to fetch a list of Matplotlib releases and their dates
    # from https://api.github.com/repos/matplotlib/matplotlib/releases
    import urllib.request
    import json

    url = 'https://api.github.com/repos/matplotlib/matplotlib/releases'
    url += '?per_page=100'
    data = json.loads(urllib.request.urlopen(url, timeout=.4).read().decode())

    dates = []
    names = []
    for item in data:
        if 'rc' not in item['tag_name'] and 'b' not in item['tag_name']:
            dates.append(item['published_at'].split("T")[0])
            names.append(item['tag_name'])
    # Convert date strings (e.g. 2014-10-18) to datetime
    dates = [datetime.strptime(d, "%Y-%m-%d") for d in dates]

except Exception:
    # In case the above fails, e.g. because of missing internet connection
    # use the following lists as fallback.
    names = ['v2.2.4', 'v3.0.3', 'v3.0.2', 'v3.0.1', 'v3.0.0', 'v2.2.3',
             'v2.2.2', 'v2.2.1', 'v2.2.0', 'v2.1.2', 'v2.1.1', 'v2.1.0',
             'v2.0.2', 'v2.0.1', 'v2.0.0', 'v1.5.3', 'v1.5.2', 'v1.5.1',
             'v1.5.0', 'v1.4.3', 'v1.4.2', 'v1.4.1', 'v1.4.0']

    dates = ['2019-02-26', '2019-02-26', '2018-11-10', '2018-11-10',
             '2018-09-18', '2018-08-10', '2018-03-17', '2018-03-16',
             '2018-03-06', '2018-01-18', '2017-12-10', '2017-10-07',
             '2017-05-10', '2017-05-02', '2017-01-17', '2016-09-09',
             '2016-07-03', '2016-01-10', '2015-10-29', '2015-02-16',
             '2014-10-26', '2014-10-18', '2014-08-26']

    # Convert date strings (e.g. 2014-10-18) to datetime
    dates = [datetime.strptime(d, "%Y-%m-%d") for d in dates]
Next, we'll create a stem plot with some variation in levels as to distinguish even close-by events. We add markers on the baseline for visual emphasis on the one-dimensional nature of the time line.
For each event, we add a text label via annotate, which is offset
in units of points from the tip of the event line.
Note that Matplotlib will automatically plot datetime inputs.
# Choose some nice levels
levels = np.tile([-5, 5, -3, 3, -1, 1],
                 int(np.ceil(len(dates)/6)))[:len(dates)]

# Create figure and plot a stem plot with the date
fig, ax = plt.subplots(figsize=(8.8, 4), constrained_layout=True)
ax.set(title="Matplotlib release dates")

ax.vlines(dates, 0, levels, color="tab:red")  # The vertical stems.
ax.plot(dates, np.zeros_like(dates), "-o",
        color="k", markerfacecolor="w")  # Baseline and markers on it.

# annotate lines
for d, l, r in zip(dates, levels, names):
    ax.annotate(r, xy=(d, l),
                xytext=(-3, np.sign(l)*3), textcoords="offset points",
                horizontalalignment="right",
                verticalalignment="bottom" if l > 0 else "top")

# format xaxis with 4 month intervals
ax.xaxis.set_major_locator(mdates.MonthLocator(interval=4))
ax.xaxis.set_major_formatter(mdates.DateFormatter("%b %Y"))
plt.setp(ax.get_xticklabels(), rotation=30, ha="right")

# remove y axis and spines
ax.yaxis.set_visible(False)
ax.spines[["left", "top", "right"]].set_visible(False)

ax.margins(y=0.1)
plt.show()
References
The use of the following functions, methods, classes and modules is shown in this example:
Total running time of the script: ( 0 minutes 1.587 seconds)
Keywords: matplotlib code example, codex, python plot, pyplot Gallery generated by Sphinx-Gallery