Note
Click here to download the full example code
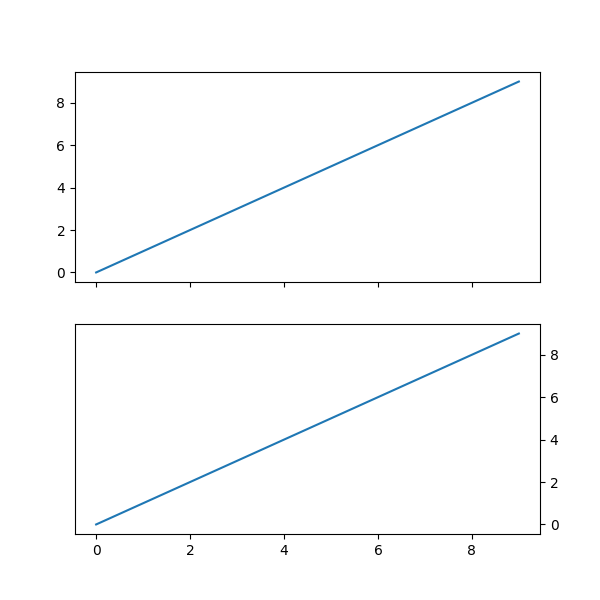
Set default y-axis tick labels on the right#
We can use rcParams["ytick.labelright"] (default: False) (default False) and rcParams["ytick.right"] (default: False)
(default False) and rcParams["ytick.labelleft"] (default: True) (default True) and rcParams["ytick.left"] (default: True)
(default True) to control where on the axes ticks and their labels appear.
These properties can also be set in the .matplotlib/matplotlibrc.
import matplotlib.pyplot as plt
import numpy as np

plt.rcParams['ytick.right'] = plt.rcParams['ytick.labelright'] = True
plt.rcParams['ytick.left'] = plt.rcParams['ytick.labelleft'] = False

x = np.arange(10)

fig, (ax0, ax1) = plt.subplots(2, 1, sharex=True, figsize=(6, 6))

ax0.plot(x)
ax0.yaxis.tick_left()

# use default parameter in rcParams, not calling tick_right()
ax1.plot(x)

plt.show()
Keywords: matplotlib code example, codex, python plot, pyplot Gallery generated by Sphinx-Gallery