Note
Click here to download the full example code
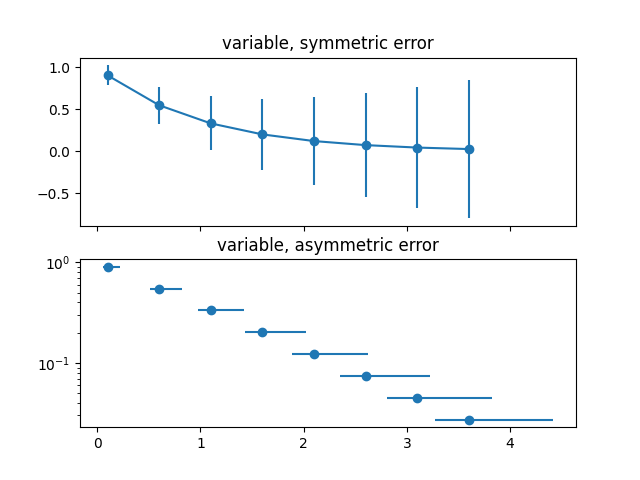
Different ways of specifying error bars#
Errors can be specified as a constant value (as shown in Errorbar function). However, this example demonstrates how they vary by specifying arrays of error values.
If the raw x and y data have length N, there are two options:
- Array of shape (N,):
Error varies for each point, but the error values are symmetric (i.e. the lower and upper values are equal).
- Array of shape (2, N):
Error varies for each point, and the lower and upper limits (in that order) are different (asymmetric case)
In addition, this example demonstrates how to use log scale with error bars.
import numpy as np
import matplotlib.pyplot as plt

# example data
x = np.arange(0.1, 4, 0.5)
y = np.exp(-x)

# example error bar values that vary with x-position
error = 0.1 + 0.2 * x

fig, (ax0, ax1) = plt.subplots(nrows=2, sharex=True)
ax0.errorbar(x, y, yerr=error, fmt='-o')
ax0.set_title('variable, symmetric error')

# error bar values w/ different -/+ errors that
# also vary with the x-position
lower_error = 0.4 * error
upper_error = error
asymmetric_error = [lower_error, upper_error]

ax1.errorbar(x, y, xerr=asymmetric_error, fmt='o')
ax1.set_title('variable, asymmetric error')
ax1.set_yscale('log')
plt.show()
References
The use of the following functions, methods, classes and modules is shown in this example:
Keywords: matplotlib code example, codex, python plot, pyplot Gallery generated by Sphinx-Gallery