Note
Click here to download the full example code
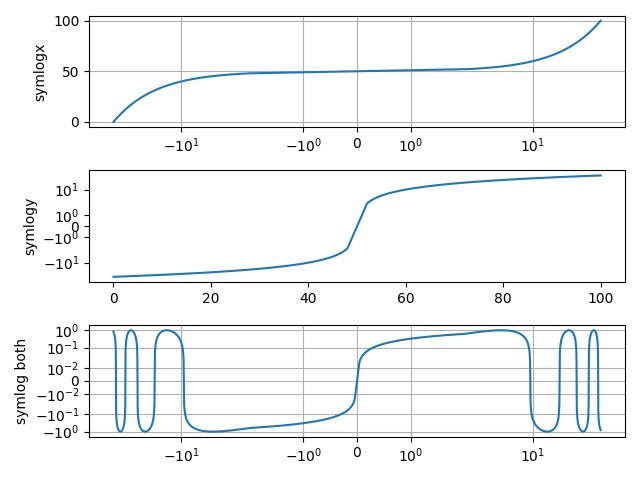
Symlog Demo#
Example use of symlog (symmetric log) axis scaling.
import matplotlib.pyplot as plt
import numpy as np

dt = 0.01
x = np.arange(-50.0, 50.0, dt)
y = np.arange(0, 100.0, dt)

fig, (ax0, ax1, ax2) = plt.subplots(nrows=3)

ax0.plot(x, y)
ax0.set_xscale('symlog')
ax0.set_ylabel('symlogx')
ax0.grid()
ax0.xaxis.grid(which='minor')  # minor grid on too

ax1.plot(y, x)
ax1.set_yscale('symlog')
ax1.set_ylabel('symlogy')

ax2.plot(x, np.sin(x / 3.0))
ax2.set_xscale('symlog')
ax2.set_yscale('symlog', linthresh=0.015)
ax2.grid()
ax2.set_ylabel('symlog both')

fig.tight_layout()
plt.show()
Keywords: matplotlib code example, codex, python plot, pyplot Gallery generated by Sphinx-Gallery