Note
Click here to download the full example code
Scale invariant angle label#
This example shows how to create a scale invariant angle annotation. It is
often useful to mark angles between lines or inside shapes with a circular arc.
While Matplotlib provides an Arc, an inherent problem when directly
using it for such purposes is that an arc being circular in data space is not
necessarily circular in display space. Also, the arc's radius is often best
defined in a coordinate system which is independent of the actual data
coordinates - at least if you want to be able to freely zoom into your plot
without the annotation growing to infinity.
This calls for a solution where the arc's center is defined in data space, but
its radius in a physical unit like points or pixels, or as a ratio of the Axes
dimension. The following AngleAnnotation class provides such solution.
The example below serves two purposes:
It provides a ready-to-use solution for the problem of easily drawing angles in graphs.
It shows how to subclass a Matplotlib artist to enhance its functionality, as well as giving a hands-on example on how to use Matplotlib's transform system.
If mainly interested in the former, you may copy the below class and jump to the Usage section.
AngleAnnotation class#
The essential idea here is to subclass Arc and set its transform
to the IdentityTransform, making the parameters of the arc
defined in pixel space.
We then override the Arc's attributes _center, theta1,
theta2, width and height and make them properties, coupling to
internal methods that calculate the respective parameters each time the
attribute is accessed and thereby ensuring that the arc in pixel space stays
synchronized with the input points and size.
For example, each time the arc's drawing method would query its _center
attribute, instead of receiving the same number all over again, it will
instead receive the result of the get_center_in_pixels method we defined
in the subclass. This method transforms the center in data coordinates to
pixels via the Axes transform ax.transData. The size and the angles are
calculated in a similar fashion, such that the arc changes its shape
automatically when e.g. zooming or panning interactively.
The functionality of this class allows to annotate the arc with a text. This
text is a Annotation stored in an attribute text. Since the
arc's position and radius are defined only at draw time, we need to update
the text's position accordingly. This is done by reimplementing the Arc's
draw() method to let it call an updating method for the text.
The arc and the text will be added to the provided Axes at instantiation: it is hence not strictly necessary to keep a reference to it.
import numpy as np
import matplotlib.pyplot as plt
from matplotlib.patches import Arc
from matplotlib.transforms import IdentityTransform, TransformedBbox, Bbox


class AngleAnnotation(Arc):
    """
    Draws an arc between two vectors which appears circular in display space.
    """
    def __init__(self, xy, p1, p2, size=75, unit="points", ax=None,
                 text="", textposition="inside", text_kw=None, **kwargs):
        """
        Parameters
        ----------
        xy, p1, p2 : tuple or array of two floats
            Center position and two points. Angle annotation is drawn between
            the two vectors connecting *p1* and *p2* with *xy*, respectively.
            Units are data coordinates.

        size : float
            Diameter of the angle annotation in units specified by *unit*.

        unit : str
            One of the following strings to specify the unit of *size*:

            * "pixels": pixels
            * "points": points, use points instead of pixels to not have a
              dependence on the DPI
            * "axes width", "axes height": relative units of Axes width, height
            * "axes min", "axes max": minimum or maximum of relative Axes
              width, height

        ax : `matplotlib.axes.Axes`
            The Axes to add the angle annotation to.

        text : str
            The text to mark the angle with.

        textposition : {"inside", "outside", "edge"}
            Whether to show the text in- or outside the arc. "edge" can be used
            for custom positions anchored at the arc's edge.

        text_kw : dict
            Dictionary of arguments passed to the Annotation.

        **kwargs
            Further parameters are passed to `matplotlib.patches.Arc`. Use this
            to specify, color, linewidth etc. of the arc.

        """
        self.ax = ax or plt.gca()
        self._xydata = xy  # in data coordinates
        self.vec1 = p1
        self.vec2 = p2
        self.size = size
        self.unit = unit
        self.textposition = textposition

        super().__init__(self._xydata, size, size, angle=0.0,
                         theta1=self.theta1, theta2=self.theta2, **kwargs)

        self.set_transform(IdentityTransform())
        self.ax.add_patch(self)

        self.kw = dict(ha="center", va="center",
                       xycoords=IdentityTransform(),
                       xytext=(0, 0), textcoords="offset points",
                       annotation_clip=True)
        self.kw.update(text_kw or {})
        self.text = ax.annotate(text, xy=self._center, **self.kw)

    def get_size(self):
        factor = 1.
        if self.unit == "points":
            factor = self.ax.figure.dpi / 72.
        elif self.unit[:4] == "axes":
            b = TransformedBbox(Bbox.from_bounds(0, 0, 1, 1),
                                self.ax.transAxes)
            dic = {"max": max(b.width, b.height),
                   "min": min(b.width, b.height),
                   "width": b.width, "height": b.height}
            factor = dic[self.unit[5:]]
        return self.size * factor

    def set_size(self, size):
        self.size = size

    def get_center_in_pixels(self):
        """return center in pixels"""
        return self.ax.transData.transform(self._xydata)

    def set_center(self, xy):
        """set center in data coordinates"""
        self._xydata = xy

    def get_theta(self, vec):
        vec_in_pixels = self.ax.transData.transform(vec) - self._center
        return np.rad2deg(np.arctan2(vec_in_pixels[1], vec_in_pixels[0]))

    def get_theta1(self):
        return self.get_theta(self.vec1)

    def get_theta2(self):
        return self.get_theta(self.vec2)

    def set_theta(self, angle):
        pass

    # Redefine attributes of the Arc to always give values in pixel space
    _center = property(get_center_in_pixels, set_center)
    theta1 = property(get_theta1, set_theta)
    theta2 = property(get_theta2, set_theta)
    width = property(get_size, set_size)
    height = property(get_size, set_size)

    # The following two methods are needed to update the text position.
    def draw(self, renderer):
        self.update_text()
        super().draw(renderer)

    def update_text(self):
        c = self._center
        s = self.get_size()
        angle_span = (self.theta2 - self.theta1) % 360
        angle = np.deg2rad(self.theta1 + angle_span / 2)
        r = s / 2
        if self.textposition == "inside":
            r = s / np.interp(angle_span, [60, 90, 135, 180],
                                          [3.3, 3.5, 3.8, 4])
        self.text.xy = c + r * np.array([np.cos(angle), np.sin(angle)])
        if self.textposition == "outside":
            def R90(a, r, w, h):
                if a < np.arctan(h/2/(r+w/2)):
                    return np.sqrt((r+w/2)**2 + (np.tan(a)*(r+w/2))**2)
                else:
                    c = np.sqrt((w/2)**2+(h/2)**2)
                    T = np.arcsin(c * np.cos(np.pi/2 - a + np.arcsin(h/2/c))/r)
                    xy = r * np.array([np.cos(a + T), np.sin(a + T)])
                    xy += np.array([w/2, h/2])
                    return np.sqrt(np.sum(xy**2))

            def R(a, r, w, h):
                aa = (a % (np.pi/4))*((a % (np.pi/2)) <= np.pi/4) + \
                     (np.pi/4 - (a % (np.pi/4)))*((a % (np.pi/2)) >= np.pi/4)
                return R90(aa, r, *[w, h][::int(np.sign(np.cos(2*a)))])

            bbox = self.text.get_window_extent()
            X = R(angle, r, bbox.width, bbox.height)
            trans = self.ax.figure.dpi_scale_trans.inverted()
            offs = trans.transform(((X-s/2), 0))[0] * 72
            self.text.set_position([offs*np.cos(angle), offs*np.sin(angle)])
Usage#
Required arguments to AngleAnnotation are the center of the arc, xy,
and two points, such that the arc spans between the two vectors connecting
p1 and p2 with xy, respectively. Those are given in data coordinates.
Further arguments are the size of the arc and its unit. Additionally, a
text can be specified, that will be drawn either in- or outside of the arc,
according to the value of textposition. Usage of those arguments is shown
below.
fig, ax = plt.subplots()
fig.canvas.draw() # Need to draw the figure to define renderer
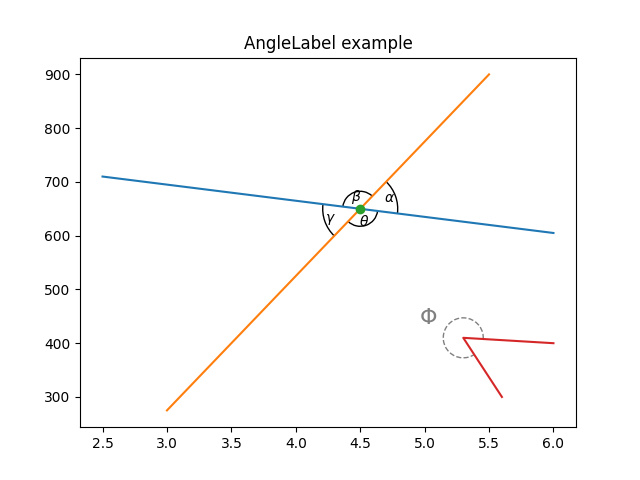
ax.set_title("AngleLabel example")
# Plot two crossing lines and label each angle between them with the above
# ``AngleAnnotation`` tool.
center = (4.5, 650)
p1 = [(2.5, 710), (6.0, 605)]
p2 = [(3.0, 275), (5.5, 900)]
line1, = ax.plot(*zip(*p1))
line2, = ax.plot(*zip(*p2))
point, = ax.plot(*center, marker="o")
am1 = AngleAnnotation(center, p1[1], p2[1], ax=ax, size=75, text=r"$\alpha$")
am2 = AngleAnnotation(center, p2[1], p1[0], ax=ax, size=35, text=r"$\beta$")
am3 = AngleAnnotation(center, p1[0], p2[0], ax=ax, size=75, text=r"$\gamma$")
am4 = AngleAnnotation(center, p2[0], p1[1], ax=ax, size=35, text=r"$\theta$")
# Showcase some styling options for the angle arc, as well as the text.
p = [(6.0, 400), (5.3, 410), (5.6, 300)]
ax.plot(*zip(*p))
am5 = AngleAnnotation(p[1], p[0], p[2], ax=ax, size=40, text=r"$\Phi$",
linestyle="--", color="gray", textposition="outside",
text_kw=dict(fontsize=16, color="gray"))
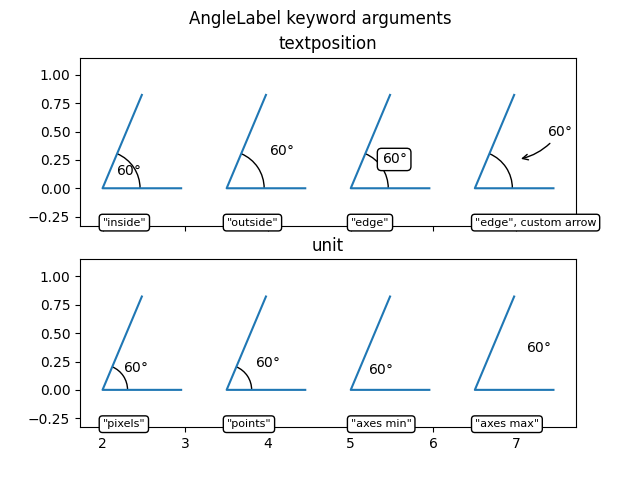
AngleLabel options#
The textposition and unit keyword arguments may be used to modify the location of the text label, as shown below:
# Helper function to draw angle easily.
def plot_angle(ax, pos, angle, length=0.95, acol="C0", **kwargs):
    vec2 = np.array([np.cos(np.deg2rad(angle)), np.sin(np.deg2rad(angle))])
    xy = np.c_[[length, 0], [0, 0], vec2*length].T + np.array(pos)
    ax.plot(*xy.T, color=acol)
    return AngleAnnotation(pos, xy[0], xy[2], ax=ax, **kwargs)


fig, (ax1, ax2) = plt.subplots(nrows=2, sharex=True)
fig.suptitle("AngleLabel keyword arguments")
fig.canvas.draw()  # Need to draw the figure to define renderer

# Showcase different text positions.
ax1.margins(y=0.4)
ax1.set_title("textposition")
kw = dict(size=75, unit="points", text=r"$60°$")

am6 = plot_angle(ax1, (2.0, 0), 60, textposition="inside", **kw)
am7 = plot_angle(ax1, (3.5, 0), 60, textposition="outside", **kw)
am8 = plot_angle(ax1, (5.0, 0), 60, textposition="edge",
                 text_kw=dict(bbox=dict(boxstyle="round", fc="w")), **kw)
am9 = plot_angle(ax1, (6.5, 0), 60, textposition="edge",
                 text_kw=dict(xytext=(30, 20), arrowprops=dict(arrowstyle="->",
                              connectionstyle="arc3,rad=-0.2")), **kw)

for x, text in zip([2.0, 3.5, 5.0, 6.5], ['"inside"', '"outside"', '"edge"',
                                          '"edge", custom arrow']):
    ax1.annotate(text, xy=(x, 0), xycoords=ax1.get_xaxis_transform(),
                 bbox=dict(boxstyle="round", fc="w"), ha="left", fontsize=8,
                 annotation_clip=True)

# Showcase different size units. The effect of this can best be observed
# by interactively changing the figure size
ax2.margins(y=0.4)
ax2.set_title("unit")
kw = dict(text=r"$60°$", textposition="outside")

am10 = plot_angle(ax2, (2.0, 0), 60, size=50, unit="pixels", **kw)
am11 = plot_angle(ax2, (3.5, 0), 60, size=50, unit="points", **kw)
am12 = plot_angle(ax2, (5.0, 0), 60, size=0.25, unit="axes min", **kw)
am13 = plot_angle(ax2, (6.5, 0), 60, size=0.25, unit="axes max", **kw)

for x, text in zip([2.0, 3.5, 5.0, 6.5], ['"pixels"', '"points"',
                                          '"axes min"', '"axes max"']):
    ax2.annotate(text, xy=(x, 0), xycoords=ax2.get_xaxis_transform(),
                 bbox=dict(boxstyle="round", fc="w"), ha="left", fontsize=8,
                 annotation_clip=True)

plt.show()
References
The use of the following functions, methods, classes and modules is shown in this example:
Keywords: matplotlib code example, codex, python plot, pyplot Gallery generated by Sphinx-Gallery