Note
Click here to download the full example code
Figure subfigures#
Sometimes it is desirable to have a figure with two different layouts in it.
This can be achieved with
nested gridspecs,
but having a virtual figure with its own artists is helpful, so
Matplotlib also has "subfigures", accessed by calling
matplotlib.figure.Figure.add_subfigure in a way that is analogous to
matplotlib.figure.Figure.add_subplot, or
matplotlib.figure.Figure.subfigures to make an array of subfigures. Note
that subfigures can also have their own child subfigures.
Note
subfigure is new in v3.4, and the API is still provisional.
import matplotlib.pyplot as plt
import numpy as np
def example_plot(ax, fontsize=12, hide_labels=False):
pc = ax.pcolormesh(np.random.randn(30, 30), vmin=-2.5, vmax=2.5)
if not hide_labels:
ax.set_xlabel('x-label', fontsize=fontsize)
ax.set_ylabel('y-label', fontsize=fontsize)
ax.set_title('Title', fontsize=fontsize)
return pc
np.random.seed(19680808)
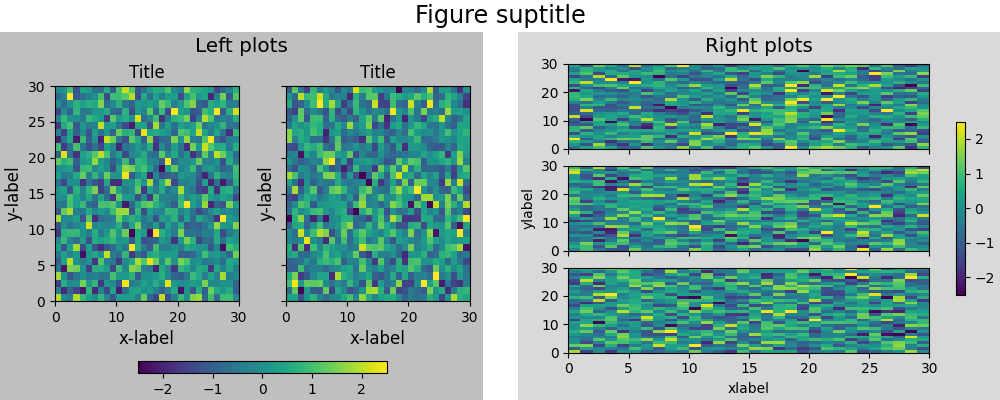
# gridspec inside gridspec
fig = plt.figure(constrained_layout=True, figsize=(10, 4))
subfigs = fig.subfigures(1, 2, wspace=0.07)
axsLeft = subfigs[0].subplots(1, 2, sharey=True)
subfigs[0].set_facecolor('0.75')
for ax in axsLeft:
pc = example_plot(ax)
subfigs[0].suptitle('Left plots', fontsize='x-large')
subfigs[0].colorbar(pc, shrink=0.6, ax=axsLeft, location='bottom')
axsRight = subfigs[1].subplots(3, 1, sharex=True)
for nn, ax in enumerate(axsRight):
pc = example_plot(ax, hide_labels=True)
if nn == 2:
ax.set_xlabel('xlabel')
if nn == 1:
ax.set_ylabel('ylabel')
subfigs[1].set_facecolor('0.85')
subfigs[1].colorbar(pc, shrink=0.6, ax=axsRight)
subfigs[1].suptitle('Right plots', fontsize='x-large')
fig.suptitle('Figure suptitle', fontsize='xx-large')
plt.show()
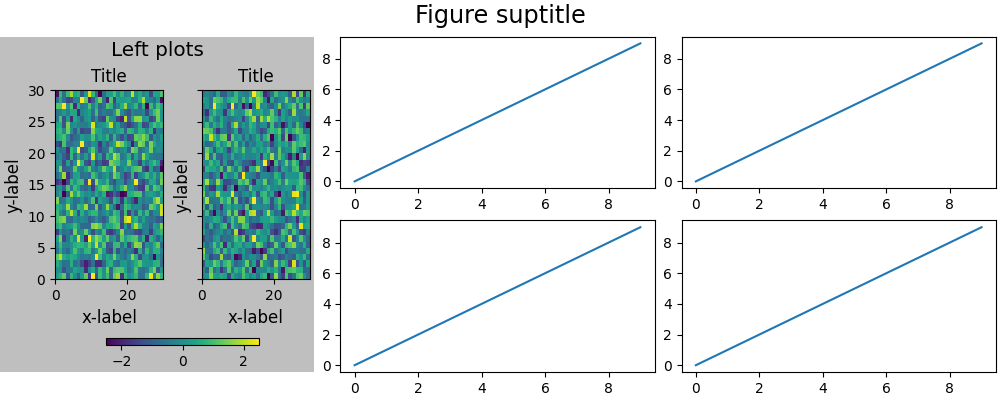
It is possible to mix subplots and subfigures using
matplotlib.figure.Figure.add_subfigure. This requires getting
the gridspec that the subplots are laid out on.
fig, axs = plt.subplots(2, 3, constrained_layout=True, figsize=(10, 4))
gridspec = axs[0, 0].get_subplotspec().get_gridspec()

# clear the left column for the subfigure:
for a in axs[:, 0]:
    a.remove()

# plot data in remaining axes:
for a in axs[:, 1:].flat:
    a.plot(np.arange(10))

# make the subfigure in the empty gridspec slots:
subfig = fig.add_subfigure(gridspec[:, 0])

axsLeft = subfig.subplots(1, 2, sharey=True)
subfig.set_facecolor('0.75')
for ax in axsLeft:
    pc = example_plot(ax)
subfig.suptitle('Left plots', fontsize='x-large')
subfig.colorbar(pc, shrink=0.6, ax=axsLeft, location='bottom')

fig.suptitle('Figure suptitle', fontsize='xx-large')
plt.show()
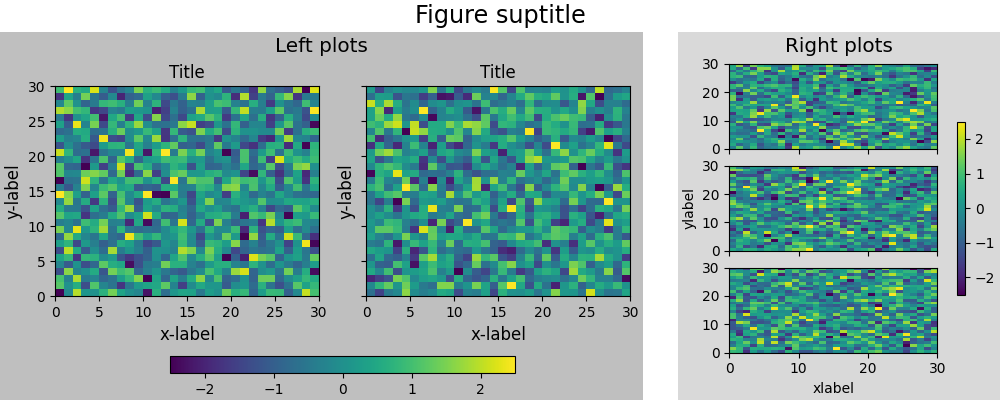
Subfigures can have different widths and heights. This is exactly the same example as the first example, but width_ratios has been changed:
fig = plt.figure(constrained_layout=True, figsize=(10, 4))
subfigs = fig.subfigures(1, 2, wspace=0.07, width_ratios=[2, 1])

axsLeft = subfigs[0].subplots(1, 2, sharey=True)
subfigs[0].set_facecolor('0.75')
for ax in axsLeft:
    pc = example_plot(ax)
subfigs[0].suptitle('Left plots', fontsize='x-large')
subfigs[0].colorbar(pc, shrink=0.6, ax=axsLeft, location='bottom')

axsRight = subfigs[1].subplots(3, 1, sharex=True)
for nn, ax in enumerate(axsRight):
    pc = example_plot(ax, hide_labels=True)
    if nn == 2:
        ax.set_xlabel('xlabel')
    if nn == 1:
        ax.set_ylabel('ylabel')

subfigs[1].set_facecolor('0.85')
subfigs[1].colorbar(pc, shrink=0.6, ax=axsRight)
subfigs[1].suptitle('Right plots', fontsize='x-large')

fig.suptitle('Figure suptitle', fontsize='xx-large')

plt.show()
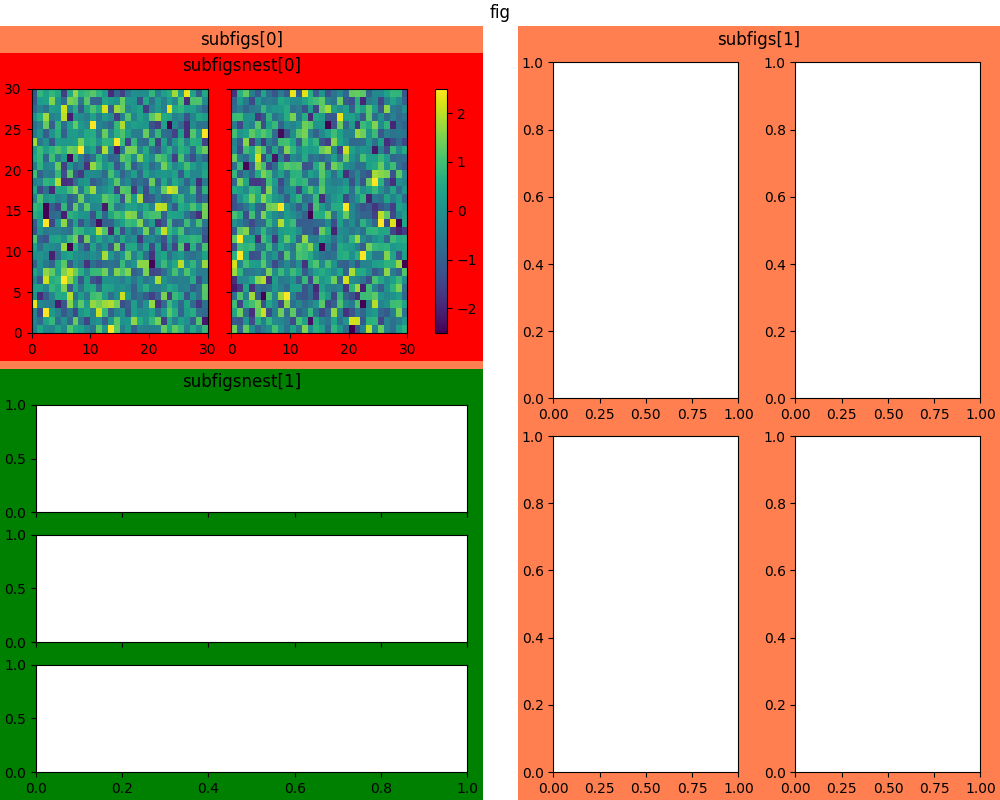
Subfigures can be also be nested:
fig = plt.figure(constrained_layout=True, figsize=(10, 8))

fig.suptitle('fig')

subfigs = fig.subfigures(1, 2, wspace=0.07)

subfigs[0].set_facecolor('coral')
subfigs[0].suptitle('subfigs[0]')

subfigs[1].set_facecolor('coral')
subfigs[1].suptitle('subfigs[1]')

subfigsnest = subfigs[0].subfigures(2, 1, height_ratios=[1, 1.4])
subfigsnest[0].suptitle('subfigsnest[0]')
subfigsnest[0].set_facecolor('r')
axsnest0 = subfigsnest[0].subplots(1, 2, sharey=True)
for nn, ax in enumerate(axsnest0):
    pc = example_plot(ax, hide_labels=True)
subfigsnest[0].colorbar(pc, ax=axsnest0)

subfigsnest[1].suptitle('subfigsnest[1]')
subfigsnest[1].set_facecolor('g')
axsnest1 = subfigsnest[1].subplots(3, 1, sharex=True)

axsRight = subfigs[1].subplots(2, 2)

plt.show()
Total running time of the script: ( 0 minutes 4.954 seconds)
Keywords: matplotlib code example, codex, python plot, pyplot Gallery generated by Sphinx-Gallery