Note
Click here to download the full example code
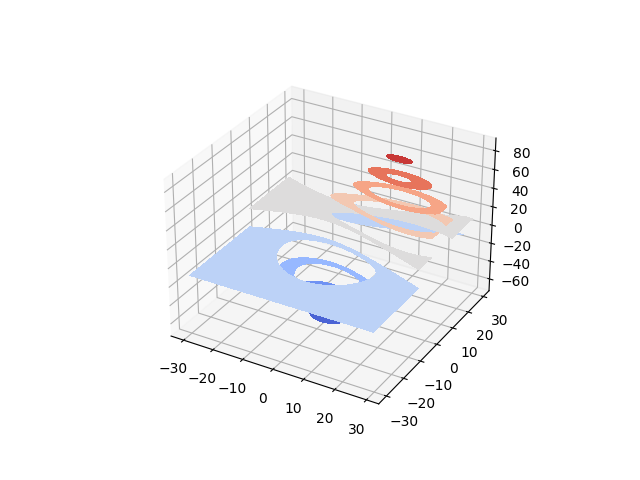
Filled contours#
contourf differs from contour in that it creates filled contours, ie. a discrete number of colours are used to shade the domain.
This is like a contourf plot in 2D except that the shaded region corresponding to the level c is graphed on the plane z=c.
from mpl_toolkits.mplot3d import axes3d
import matplotlib.pyplot as plt
from matplotlib import cm

ax = plt.figure().add_subplot(projection='3d')
X, Y, Z = axes3d.get_test_data(0.05)
ax.contourf(X, Y, Z, cmap=cm.coolwarm)

plt.show()
Keywords: matplotlib code example, codex, python plot, pyplot Gallery generated by Sphinx-Gallery