Note
Click here to download the full example code
Plotting categorical variables#
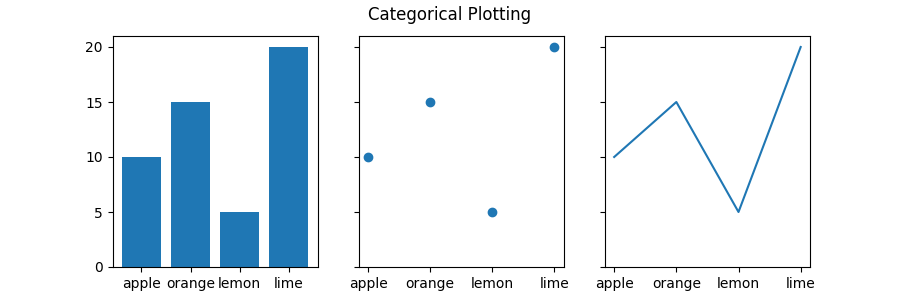
You can pass categorical values (i.e. strings) directly as x- or y-values to many plotting functions:
import matplotlib.pyplot as plt

data = {'apple': 10, 'orange': 15, 'lemon': 5, 'lime': 20}
names = list(data.keys())
values = list(data.values())

fig, axs = plt.subplots(1, 3, figsize=(9, 3), sharey=True)
axs[0].bar(names, values)
axs[1].scatter(names, values)
axs[2].plot(names, values)
fig.suptitle('Categorical Plotting')
Out:
Text(0.5, 0.98, 'Categorical Plotting')
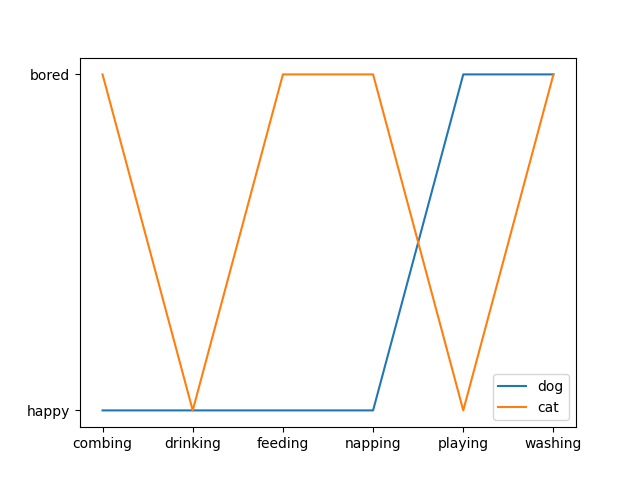
This works on both axes:
cat = ["bored", "happy", "bored", "bored", "happy", "bored"]
dog = ["happy", "happy", "happy", "happy", "bored", "bored"]
activity = ["combing", "drinking", "feeding", "napping", "playing", "washing"]

fig, ax = plt.subplots()
ax.plot(activity, dog, label="dog")
ax.plot(activity, cat, label="cat")
ax.legend()

plt.show()
Keywords: matplotlib code example, codex, python plot, pyplot Gallery generated by Sphinx-Gallery