Note
Click here to download the full example code
Placing Colorbars#
Colorbars indicate the quantitative extent of image data. Placing in a figure is non-trivial because room needs to be made for them.
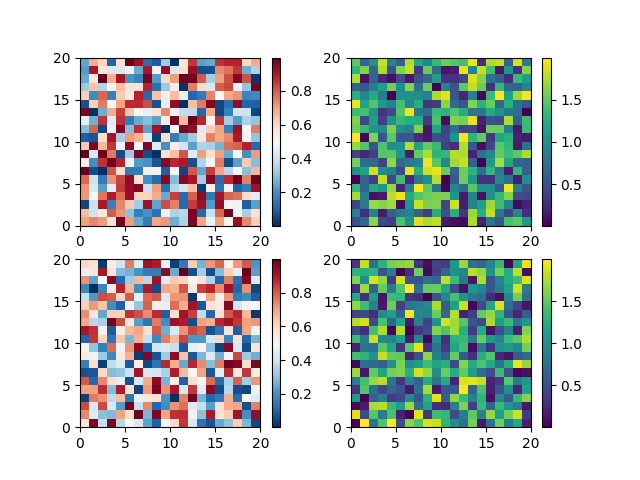
The simplest case is just attaching a colorbar to each axes:
import matplotlib.pyplot as plt
import numpy as np


# Fixing random state for reproducibility
np.random.seed(19680801)

fig, axs = plt.subplots(2, 2)
cmaps = ['RdBu_r', 'viridis']
for col in range(2):
    for row in range(2):
        ax = axs[row, col]
        pcm = ax.pcolormesh(np.random.random((20, 20)) * (col + 1),
                            cmap=cmaps[col])
        fig.colorbar(pcm, ax=ax)
plt.show()
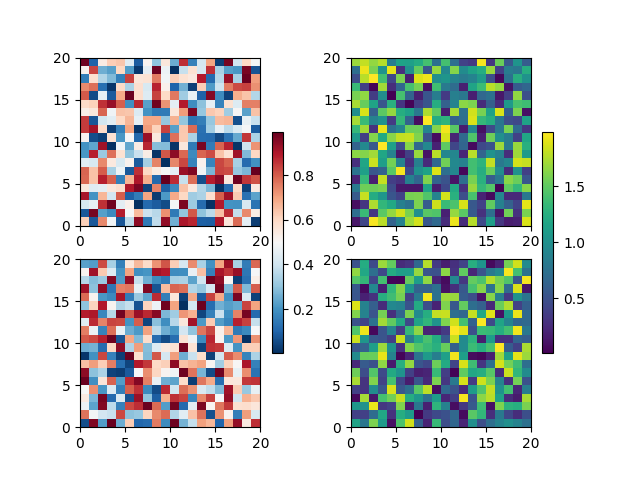
The first column has the same type of data in both rows, so it may
be desirable to combine the colorbar which we do by calling
Figure.colorbar with a list of axes instead of a single axes.
fig, axs = plt.subplots(2, 2)
cmaps = ['RdBu_r', 'viridis']
for col in range(2):
    for row in range(2):
        ax = axs[row, col]
        pcm = ax.pcolormesh(np.random.random((20, 20)) * (col + 1),
                            cmap=cmaps[col])
    fig.colorbar(pcm, ax=axs[:, col], shrink=0.6)
plt.show()
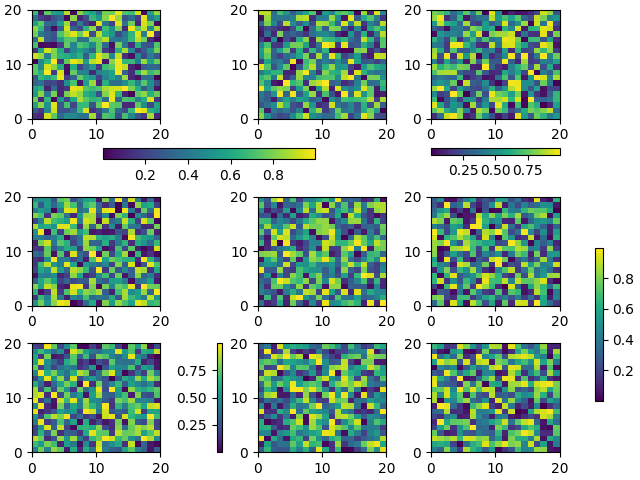
Relatively complicated colorbar layouts are possible using this
paradigm. Note that this example works far better with
constrained_layout=True
fig, axs = plt.subplots(3, 3, constrained_layout=True)
for ax in axs.flat:
    pcm = ax.pcolormesh(np.random.random((20, 20)))

fig.colorbar(pcm, ax=axs[0, :2], shrink=0.6, location='bottom')
fig.colorbar(pcm, ax=[axs[0, 2]], location='bottom')
fig.colorbar(pcm, ax=axs[1:, :], location='right', shrink=0.6)
fig.colorbar(pcm, ax=[axs[2, 1]], location='left')
plt.show()
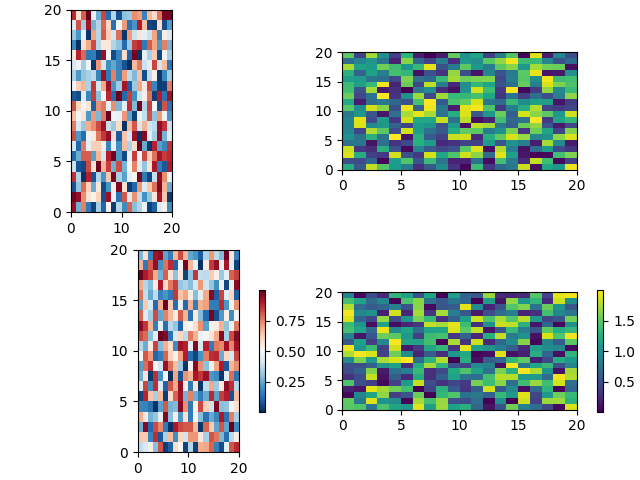
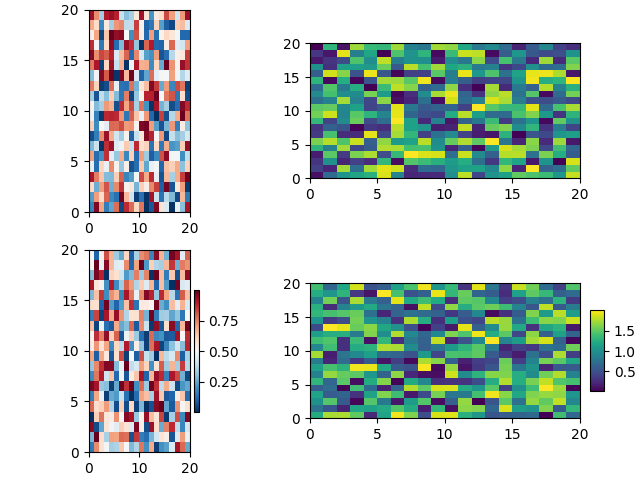
Colorbars with fixed-aspect-ratio axes#
Placing colorbars for axes with a fixed aspect ratio pose a particular challenge as the parent axes changes size depending on the data view.
fig, axs = plt.subplots(2, 2,  constrained_layout=True)
cmaps = ['RdBu_r', 'viridis']
for col in range(2):
    for row in range(2):
        ax = axs[row, col]
        pcm = ax.pcolormesh(np.random.random((20, 20)) * (col + 1),
                            cmap=cmaps[col])
        if col == 0:
            ax.set_aspect(2)
        else:
            ax.set_aspect(1/2)
        if row == 1:
            fig.colorbar(pcm, ax=ax, shrink=0.6)
plt.show()
One way around this issue is to use an Axes.inset_axes to locate the
axes in axes coordinates. Note that if you zoom in on the axes, and
change the shape of the axes, the colorbar will also change position.
fig, axs = plt.subplots(2, 2, constrained_layout=True)
cmaps = ['RdBu_r', 'viridis']
for col in range(2):
    for row in range(2):
        ax = axs[row, col]
        pcm = ax.pcolormesh(np.random.random((20, 20)) * (col + 1),
                            cmap=cmaps[col])
        if col == 0:
            ax.set_aspect(2)
        else:
            ax.set_aspect(1/2)
        if row == 1:
            cax = ax.inset_axes([1.04, 0.2, 0.05, 0.6], transform=ax.transAxes)
            fig.colorbar(pcm, ax=ax, cax=cax)
plt.show()
Total running time of the script: ( 0 minutes 3.991 seconds)
Keywords: matplotlib code example, codex, python plot, pyplot Gallery generated by Sphinx-Gallery